


Turning Salesforce Data Into Clear Charts
Salesforce holds a lot of data, from Opportunities and Cases to custom objects. While reports can summarize numbers, it is not always easy to quickly understand trends or spot patterns from tables alone. Teams often struggle to present data in a way that is visual and easy to read, especially for users who are not data experts.
Charts make data easier to understand. With Lightning charts, users can see trends, compare numbers, and make faster decisions. However, adding charts in Salesforce can be tricky. Many solutions require custom coding or external tools, which can be time-consuming and complicated.
Insight:
The 2025 Data Empowerment Report shows that nearly 9 out of 10 respondents use graphs and charts to present data internally or externally, showing how widely chart visuals are used in organizational reporting.
In this article, we explore a simple way to bring charts using Chart.js in Lightning web component. We will cover what it does, how to install it, who can use it, and the main benefits and drawbacks. By the end, you will understand if this component fits your Salesforce needs.
Overview of Lightning Web Chart.js Component
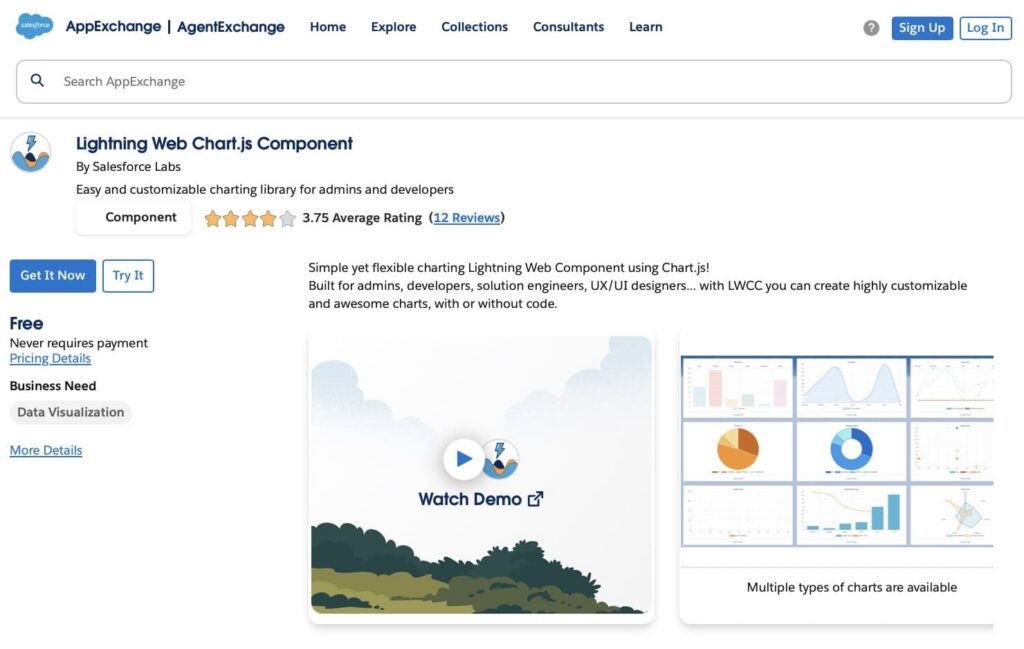
The Chart.js Salesforce Lightning is a tool for Salesforce that allows users to display a chart Lightning web component directly on pages. It uses the popular Chart.js library to create visual representations of data, such as bar charts, line charts, pie charts, and doughnut charts. This component helps users quickly understand trends, compare numbers, and communicate insights clearly without needing advanced coding skills.
It is suitable for both Salesforce admins and developers. Admins can add the component to pages with clicks, while developers can integrate it into custom Lightning Web Components for more advanced use cases.
Key Features:
- Supports multiple chart types: bar, line, pie, doughnut, and more.
- Fully responsive Lightning web components charts that adjust to desktop, tablet, and mobile screens.
- Can fetch data directly from Salesforce using SOQL queries for supported chart types.
- Open-source, allowing developers to customize and extend the functionality.
- Easy to install from AppExchange or deploy via Salesforce CLI.
- Allows setting chart labels, titles, and display options through configuration.
- Works in standard Lightning pages and custom Lightning Web Components.
Who Uses This Component
The app is designed to bring charts into Salesforce pages, making data easier to understand. While the main users are Salesforce admins and developers, other roles in the organization also benefit from the visual insights once the charts are deployed. For developers, working with such components can help practice for Salesforce LWC interview questions.
Roles and Usage:
1. Salesforce Admins: Admins can add the component to pages without writing code. They create visual reports and dashboards that help teams understand data quickly and monitor key metrics.
2. Salesforce Developers: Developers can embed the component into custom applications or Lightning Web Components. They can use Chart.js features to build dynamic, interactive charts that enhance the user experience.
3. Business Analysts / Managers: Analysts and managers may not configure Lightning charts Salesforce themselves, but they rely on the visualizations on dashboards and record pages to track trends, analyze performance, and make informed decisions.
4. End Users / Sales and Service Teams: These users interact with charts embedded in Salesforce pages, enabling them to quickly interpret data, spot trends, and act on insights without digging into reports or spreadsheets.

Installing the App
Installing the Lightning Web Chart.js Component in Salesforce is a simple process. You can install it directly from AppExchange and then add it to your Lightning pages using the App Builder. Follow these detailed steps to set it up correctly.
Option 1. Install from AppExchange
- Install from AppExchange: Go to Salesforce AppExchange, search for Lightning Web Chart.js Component, open the listing, click “Get It Now” or “Try It”.

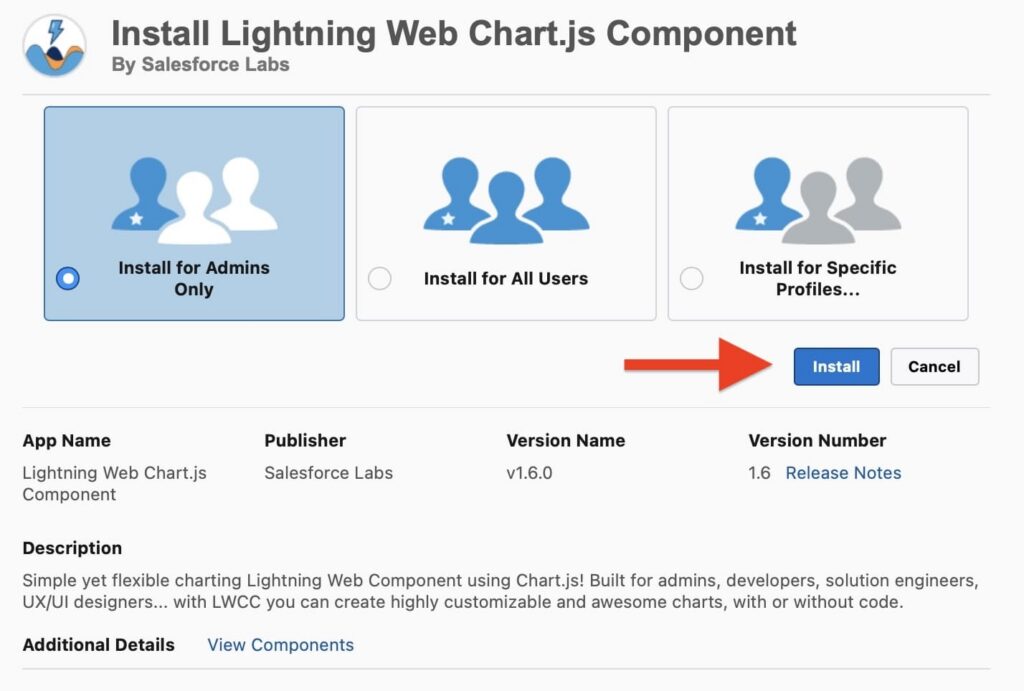
- Select your org (Production or Sandbox), agree to the license, and confirm the installation. Wait for it to complete.
- Assign permissions: After installation, assign access to profiles or permission sets so that users can view and interact with the component.

- Add to a Lightning page: Open the Lightning App Builder on a record page, home page, or app page. Locate the Lightning Web Chart in the custom components panel and drag it onto the page.
- Configure the chart: Set the chart type, choose the data source (SOQL or JSON), and define labels, titles, and display options.
- Save, activate, and preview: Save the page, activate it, and preview to make sure the charts in Lightning component display correctly. Adjust settings if necessary.
Once installed, the component is ready to be added to pages through the App Builder.
Option 2: Install Using Salesforce CLI
The Lightning Web Chart.js Component can also be installed using Salesforce CLI. This approach is intended for developers who work with source code and follow Salesforce DX development practices. It allows the component to be deployed directly from the project repository and used in a development or scratch org.
- Set up the development environment: Install Salesforce CLI and a code editor such as VS Code. Make sure you have access to a Dev Hub enabled Salesforce org.
- Authenticate with Salesforce: Log in to your Salesforce org using Salesforce CLI so it can be used for development and deployment tasks.
- Clone the project repository: Download the Lightning Web Chart.js source code from the official GitHub repository to your local machine.
- Create a development org: Create a scratch org based on the project configuration provided in the repository.
- Deploy the source code: Deploy the component to the org using standard Salesforce DX deployment commands.
- Assign required permissions: Apply the permission sets included in the project so the component can be used.
- Verify the installation: Open the org and confirm that the Lightning Web Chart.js Component is available in Lightning App Builder.
- Use the component: Add the component to Lightning pages or integrate it into custom Lightning Web Components as needed.
How It Works in Salesforce
To add a Salesforce LWC chart component to a page, open the App Builder and locate the component. Drag it to the desired position on the page. Users can set chart properties, including the type of charts in Lightning components, title, data source, and labels.
The component can pull data directly from Salesforce using a SOQL query. This allows Salesforce Lightning charts to display real-time data from objects such as Opportunities, Cases, or custom objects.

To understand how the Lightning Web Chart.js performs in real projects, we reviewed and analyzed user feedback published on Salesforce AppExchange. Based on this review analysis, we summarized the most common pros and cons mentioned by users.
Pros Based on Reviews
Users generally describe this free Salesforce charts component as reliable and flexible, especially for teams that need custom charts outside of standard Salesforce dashboards. Both admins and developers highlight ease of use and strong technical capabilities.
- Easy to install and quick to get started.
- Clean and maintainable code.
- Supports multiple data sources, including SOQL, JSON, and custom Apex providers.
- Useful alternative to standard Salesforce reporting and dashboards.
- Familiar and convenient for developers who already use Chart.js.
Cons Based on Reviews
Some users report issues related to configuration, mobile usability, and advanced customization. These concerns are mostly tied to specific setups or earlier versions of the package.
- Earlier limitations when extending custom Apex data providers.
- Charts may be difficult to use on mobile due to layout and legend sizing.
- Errors are reported when configuring the component in Lightning App Builder.
- Confusion around the Custom Data Provider setting in some orgs.
Final Thoughts on Using Lightning Web Chart.js in Salesforce
Displaying charts directly on Salesforce pages can be challenging, especially when teams need insights beyond standard dashboards. The Lightning Web Chart.js Component provides a way to add charts that visualize Salesforce data in a variety of formats, including bar, line, pie, and doughnut charts.
The component supports multiple data sources such as SOQL queries, JSON data, or custom Apex classes, giving teams flexibility in how charts are populated. Salesforce AppExchange charts component reviews show that it is generally reliable and useful for both admins and developers, and teams looking to hire Lightning developers can leverage such components effectively, though some users report configuration issues or limitations on mobile devices.

Antonina is a Salesforce Admin with six certifications: Salesforce Certified Platform Foundations, Platform Administrator, Platform Administrator II, CPQ Administrator, AI Associate, and Agentforce Specialist. She started working with Salesforce in 2021 as Intern Salesforce Developer. Now, a 2-Star Ranger on Trailhead, she continues to expand her skills and knowledge. She helps manage Salesforce systems, automate tasks, and improve processes. Antonina loves learning new things and exploring better ways to use technology. In her free time, she enjoys reading, playing sports, and exploring new tech ideas.
 Previous Post
 Next Post