
The Salesforce AppExchange doesn’t slow down. Just a year ago, it had just over 5,100 apps. As of May 2025, that number’s climbed to almost 6,000. But this article isn’t about throwing big numbers around. It’s about what those numbers tell us.
We went through the data, not just from this month, but also from six months and a year ago, to spot what’s actually changing. Are certain types of apps growing faster? Are more developers jumping in? Are users leaving reviews? Are they happy?
And yes, the short answer to most of those is “it depends”.
Imagine you’re a Salesforce admin looking for a project management tool. A year ago, you’d find a few dozen options. Now? There are over a hundred, from free templates to full-blown platforms with analytics and automation built in. That’s exciting, but also overwhelming. What’s worth your time? What’s quietly gathering dust with zero reviews?
That’s where this piece comes in.
We’ll look at the categories with the most growth, highlight where developers are focusing their efforts, and point out areas where the AppExchange is still wide open. We’re also bringing in previous reports like the AppExchange Apps Stats 2024 and AppExchange Apps Stats 2025 start, to give you the full picture.
- AppExchange Growth Snapshot: 6-Month and 1-Year View
- Apps on AppExchange by Business Needs, Top-Level Categories
- Industry Tags – Focus Areas and Cross-Vertical Apps
- Salesforce AppExchange App Usage by Job Type
- May 2025 Salesforce AppExchange Review Activity and Rating Distribution
- Top 10 Most Reviewed Apps on AppExchange – May 2025
- Pricing Trends on AppExchange
- Summary and Takeaways
Everything here is based on publicly available data from the Business Need and Industry filters, with no guessing, no fluff.
Let’s see what’s really happening behind the numbers.
AppExchange Growth Snapshot: 6-Month and 1-Year View
The numbers alone say a lot: from May 2024 to May 2025, Salesforce AppExchange added 809 new apps and welcomed 492 more developers. That’s more than 15% growth in both areas in just a year.
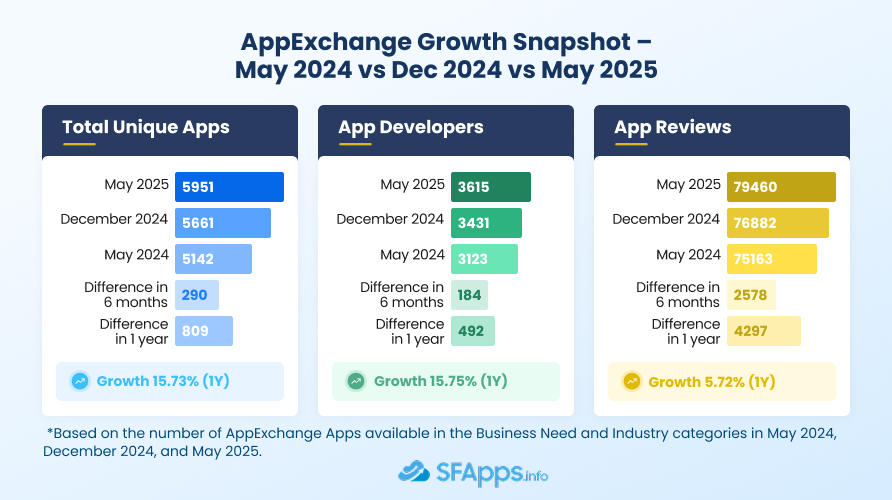
Even in the last six months, the marketplace grew by 290 apps and added 184 new developers. And while review activity didn’t skyrocket, it’s still up by over 2,500 new reviews compared to December 2024.
Here’s a quick breakdown:
| AppExchange State in 1 Year | ||||||
| Metric | May 2024 | Dec 2024 | May 2025 | 6-Month Change | 12-Month Change | Growth % (1Y) |
| Unique Apps | 5142 | 5661 | 5951 | +290 | +809 | +15.73% |
| App Developers | 3123 | 3431 | 3615 | +184 | +492 | +15.75% |
| Reviews | 75163 | 76882 | 79460 | +2578 | +4297 | +5.72% |
| *Based on the number of AppExchange Apps available in the Business Need and Industry categories in May 2024, December 2024, and May 2025. | ||||||
What does this actually mean?
It means more options for users. More competition for developers. And more pressure for new apps to stand out. The AppExchange isn’t just growing, it’s maturing. The bar is getting higher, and the apps that succeed are the ones that can prove their value fast.
Apps on AppExchange by Business Needs, Top-Level Categories
Let’s talk about where the app growth is actually happening.
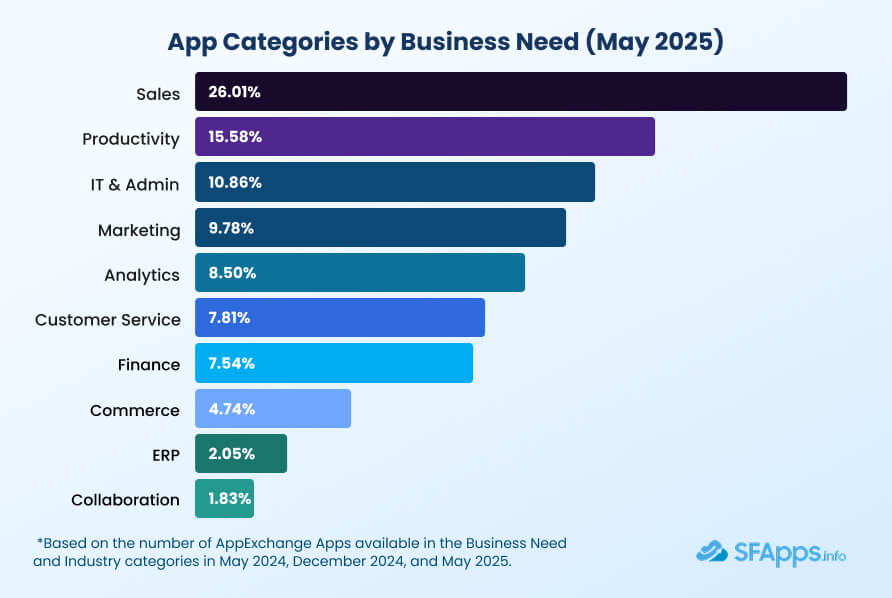
The AppExchange now hosts 5951 apps, and when we group them by main business need, the results aren’t too surprising, but they’re still telling. Sales continues to lead the pack by a wide margin, with over 1,500 apps. That’s more than a quarter of the entire marketplace.
Here’s how things break down as of May 2025:
| Breakdown of Apps on AppExchange May 2025 by Main Business Need | ||
| Category | # of Apps | % of All Apps |
| Sales | 1548 | 26.01% |
| Productivity | 927 | 15.58% |
| IT & Admin | 646 | 10.86% |
| Marketing | 582 | 9.78% |
| Analytics | 506 | 8.50% |
| Customer Service | 465 | 7.81% |
| Finance | 449 | 7.54% |
| Commerce | 282 | 4.74% |
| ERP | 122 | 2.05% |
| Collaboration | 109 | 1.83% |
| Industry-specific | 313 | 5.26% |
| *Based on the number of AppExchange Apps available in the Business Need and Industry categories in May 2025. **Two apps were listed without a defined main business category. | ||
What stands out?
The AppExchange still reflects Salesforce’s roots, tools for selling, reporting, and staying organized. But productivity apps (document generation, project management, scheduling) are catching up fast. They’re not just side tools anymore, they’re central to how Salesforce is used day-to-day.
Meanwhile, categories like ERP, Collaboration, and Commerce remain underrepresented. That’s something to watch, or even build for, if you’re a developer looking for less crowded territory.
Insight:
Did you know that some AppExchange categories still don’t have any apps listed? As of May 2025, three top-level business needs have zero apps: Augmented Reality & Virtual Reality, Punchout System, and Content Delivery Network. These areas may be too niche or haven’t received much attention from developers yet. For ISV partners looking for low-competition spaces, these categories could be a smart place to start.
Want to explore what’s inside each business category? You can check this detailed analysis of Salesforce apps for deeper insights.
Industry Tags – Focus Areas and Cross-Vertical Apps
Looking at apps by business category shows what they exactly do: quoting, reporting, onboarding, and so on. But looking at them by Industry shows who they’re made for. And that’s where the AppExchange starts to tell a different story.
As of May 2025, 2,588 apps are tagged with at least one industry. That’s a little less than half of all apps on the marketplace. It means many developers are either building for very broad use cases or skipping industry tagging altogether.
But when developers do tag their apps, they often go wide. Nearly 50% of industry-tagged apps are linked to three industries. Only 37.5% of apps are marked for a single vertical. A small number are tagged for as many as 7, 9, or even 18 different industries, though those are outliers.
How many industries per app?
| Number of Apps on AppExchange With Single or Multiple Industries Tagged | ||
| # of Industries Tagged | # of Apps | % of Industry-Tagged Apps |
| 1 | 971 | 37.52% |
| 2 | 295 | 11.40% |
| 3 | 1272 | 49.15% |
| 4 or more | 50+ | ~1.93% |
| *Based on the number of AppExchange Apps available in the Business Need and Industry categories in May 2025. | ||
This spread tells us two things:
- Many apps are designed to be cross-industry from the start.
- But there’s also a risk that wide tagging is used for visibility, even if the app doesn’t truly serve that many industries well.
Top industries on AppExchange in 2025
Here’s how the industry-tagged apps break down by vertical:
| AppExchange Industries Breakdown by Number of Apps Presented in May 2025 | ||
| Industry | # of Apps | % of Industry-Tagged Apps |
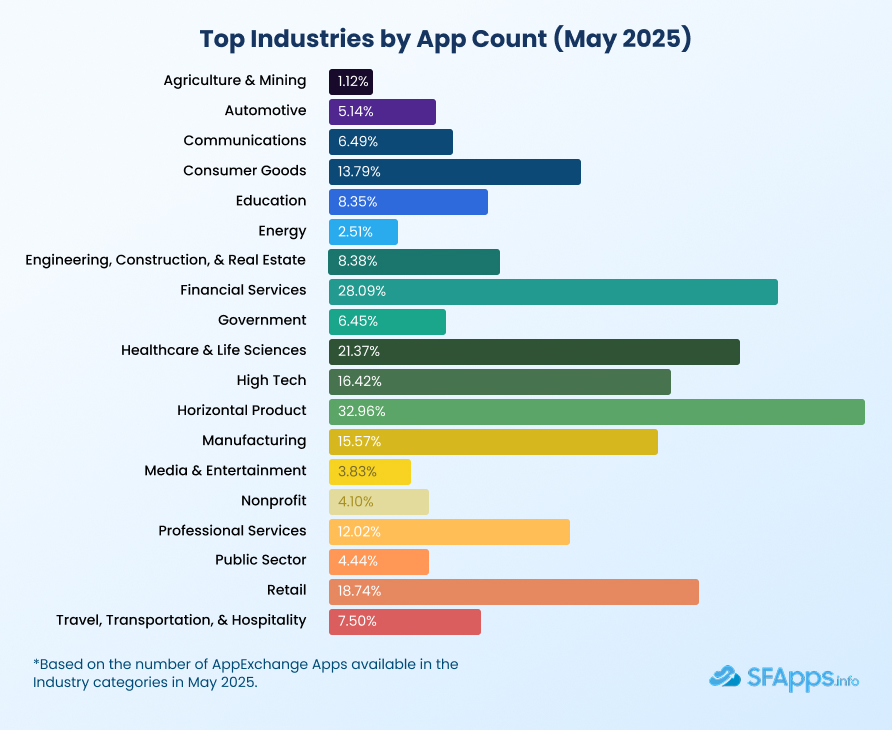
| Horizontal Product (general tools) | 853 | 32.96% |
| Financial Services | 727 | 28.09% |
| Healthcare & Life Sciences | 553 | 21.37% |
| Retail | 485 | 18.74% |
| High Tech | 425 | 16.42% |
| Manufacturing | 403 | 15.57% |
| Consumer Goods | 357 | 13.79% |
| Professional Services | 311 | 12.02% |
| Engineering, Construction & Real Estate | 217 | 8.38% |
| Education | 216 | 8.35% |
| Travel, Transportation & Hospitality | 194 | 7.50% |
| Government | 167 | 6.45% |
| Communications | 168 | 6.49% |
| Public Sector | 115 | 4.44% |
| Nonprofit | 106 | 4.10% |
| Media & Entertainment | 99 | 3.83% |
| Energy | 65 | 2.51% |
| Automotive | 133 | 5.14% |
| Agriculture & Mining | 29 | 1.12% |
| *Based on the number of AppExchange Apps available in the Business Need and Industry categories in May 2025. | ||
What does this mean for ISVs and users?
- If you’re an industry buyer (e.g., running Salesforce in a healthcare or finance org), your options are growing.
- If you’re a developer, it’s worth knowing where the crowd is, and where it isn’t. Fields like nonprofit, education, and energy have fewer targeted apps, which could mean less competition and room to stand out.
Insight:
Fun fact: “Horizontal Product” is now the largest industry group, which actually means many of these apps are built for any industry, or didn’t have a more specific tag.
You don’t have to build an app for everyone. But if you’re serving a niche well, that’s sometimes even better.
Salesforce AppExchange App Usage by Job Type
Not every Salesforce app is built for the same kind of user. Some are made with admins in mind, others target sales managers, marketers, analysts, or even executives. Looking at which roles apps are designed for gives us a clearer view of how AppExchange is being used across different teams.
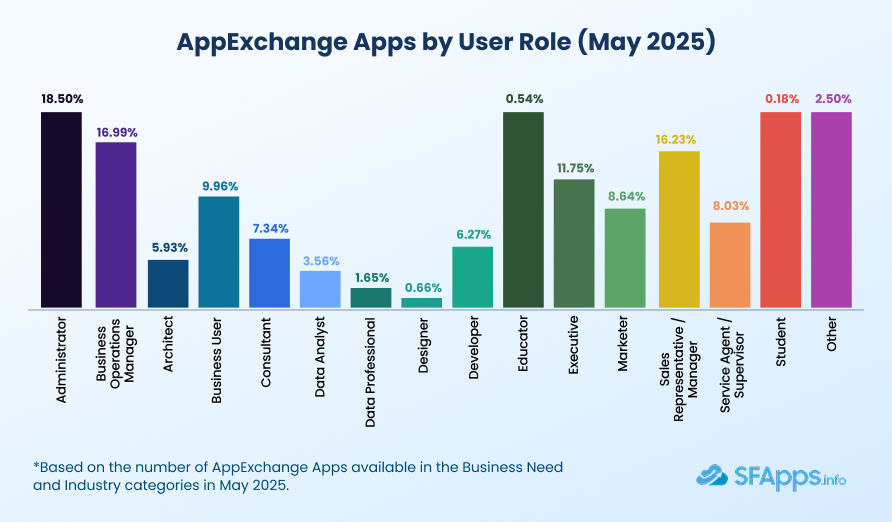
As of May 2025, AppExchange apps most often target Salesforce Administrators, Sales Reps/Managers, and Business Operations Managers. That makes sense, these are the people who configure Salesforce, run processes, or chase KPIs every day.
Here’s the full breakdown:
| Breakdown of Salesforce AppExchange App Usage by Job Type in May 2025 | ||
| Job Role | # of Apps | % of Apps |
| Administrator | 1101 | 18.50% |
| Business Operations Manager | 1011 | 16.99% |
| Sales Rep / Sales Manager | 966 | 16.23% |
| Executive | 699 | 11.75% |
| Business User | 593 | 9.96% |
| Marketer | 514 | 8.64% |
| Service Agent / Supervisor | 478 | 8.03% |
| Consultant | 437 | 7.34% |
| Developer | 373 | 6.27% |
| Architect | 353 | 5.93% |
| Data Analyst | 212 | 3.56% |
| Other | 149 | 2.50% |
| Data Professional | 98 | 1.65% |
| Designer | 39 | 0.66% |
| Educator | 32 | 0.54% |
| Student | 11 | 0.18% |
| *Based on the number of AppExchange Apps available in the Business Need, Industry, and Job Type/Role categories in May 2025. | ||
What does this tell us?
Most apps are made for the teams doing the work – configuring, managing, and operating Salesforce day to day. But it’s also interesting to see how much is now being built for executives and business users, tools that surface insights, simplify decision-making, or help leadership stay on top of performance.
There’s also a small but growing slice of apps built for technical users, like developers, architects, and data teams. These apps might not make the top of the charts, but they’re essential for companies doing deeper custom work or integrations.
So, whether you’re managing campaigns, running forecasting, or designing process flows, the AppExchange probably has something built for your role.
May 2025 Salesforce AppExchange Review Activity and Rating Distribution
App listings without user feedback are still common on the AppExchange, surprisingly common. While Salesforce users are browsing more apps than ever, they’re not reviewing them at the same pace. This section looks at which apps get reviewed, how those reviews are scored, and how the patterns have shifted over time.
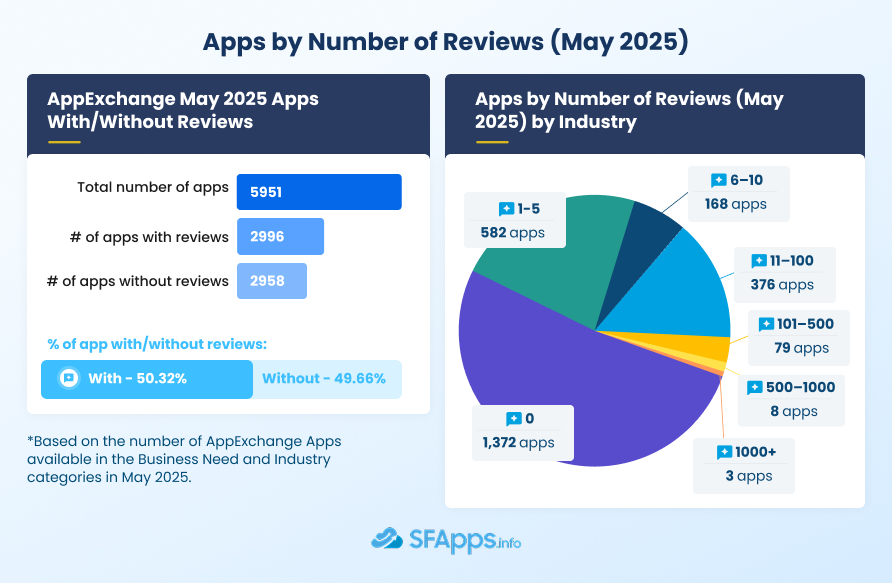
Apps With and Without Reviews
As of May 2025, just over 50% of apps have at least one review, while nearly half have none at all. And the trend has been slowly moving in the wrong direction.
| Apps With/Without Reviews, Yearly Comparison | |||
| Month | Total Number of Apps | % With Reviews | % Without Reviews |
| May 2024 | 5142 | 52.21% | 47.79% |
| Dec 2024 | 5661 | 50.58% | 49.43% |
| May 2025 | 5951 | 50.33% | 49.66% |
| *Based on the number of AppExchange Apps available in the Business Need and Industry categories in May 2024, December 2024, and May 2025. | |||
Even though the total number of apps keeps growing, the percentage of reviewed apps is shrinking slightly. This may point to one of two things: either new apps aren’t getting traction fast enough, or users aren’t motivated to leave feedback.
That’s something ISVs should pay attention to, because apps with reviews get more trust, more visibility, and more installs.
Average Number of Reviews per App
Although the total number of reviews has increased over the past year, the average number of reviews per app has declined slightly. In May 2024, the average stood at approximately 14.62 reviews per app, while in May 2025, it decreased to 13.36 reviews per app.
May 2024: 75,163 reviews / 5,142 apps = 14.62 reviews per app
May 2025: 79,506 reviews / 5,951 apps = 13.36 reviews per app
This indicates that while review activity continues to grow, it has not kept pace with the rising number of published apps. As a result, many new listings struggle to generate early user engagement, which remains a key factor in establishing trust and visibility on the AppExchange.
AppExchange Star Ratings: Rounded Rating Breakdown
You might expect most Salesforce AppExchange apps to have at least a few ratings by now, but in reality, more than half of them still don’t. And that gap is growing.
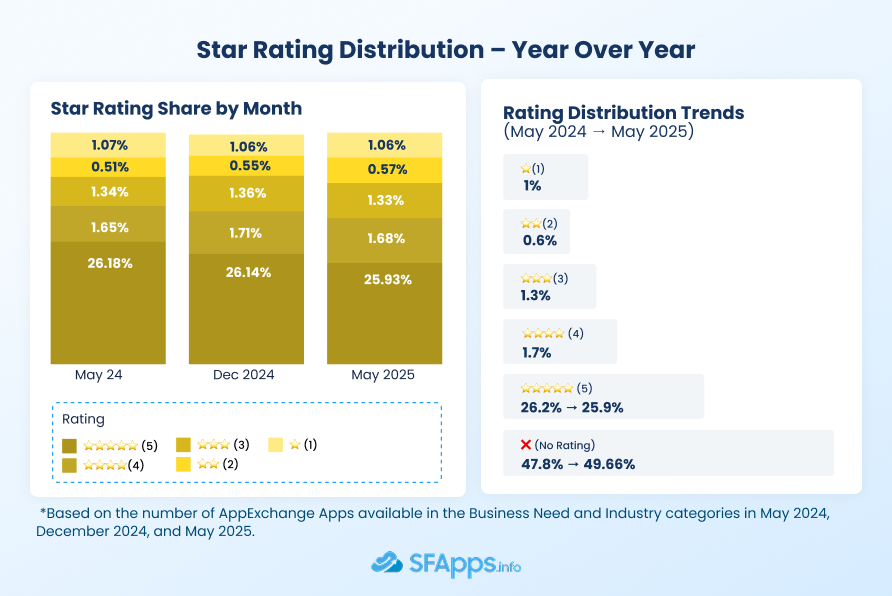
As of May 2025, 49.66% of all apps have no rating at all. That’s a big jump from a year ago, when that number was under 48%. So while more apps are being published, they’re not all getting the same visibility or engagement.
Average Star Rating Comparison
Among apps that have received at least one rating, the average star rating as of May 2025 is 4.51. This reflects a slight increase from 4.50 in May 2024. While the difference is minimal, it suggests that overall user satisfaction has remained consistently high across the reviewed apps.
This stability in ratings, despite the growing number of listings, points to the continued quality of top-rated solutions. However, with nearly half of all apps still unrated, the average reflects only a portion of the marketplace, underscoring the importance for developers to actively gather feedback from early users.
Here’s how the numbers have changed over time:
| Apps With/Without Rating Yearly Comparison | |||||
| Rating | May 2024 | Dec 2024 | May 2025 | 6-Mo Change | 1-Yr Change |
| ⭐⭐⭐⭐⭐ (5) | 1346 | 1480 | 1543 | +63 | +197 |
| % of Total | 26.18% | 26.14% | 25.93% | –0.22% | –0.25% |
| ⭐⭐⭐⭐ (4) | 85 | 97 | 100 | +3 | +15 |
| % of Total | 1.65% | 1.71% | 1.68% | –0.03% | +0.03% |
| ⭐⭐⭐ (3) | 69 | 77 | 79 | +2 | +10 |
| % of Total | 1.34% | 1.36% | 1.33% | –0.03% | –0.01% |
| ⭐⭐ (2) | 26 | 31 | 34 | +3 | +8 |
| % of Total | 0.51% | 0.55% | 0.57% | +0.02% | +0.07% |
| ⭐ (1) | 55 | 60 | 63 | +3 | +8 |
| % of Total | 1.07% | 1.06% | 1.06% | 0.00% | –0.01% |
| No Rating | 2458 | 2798 | 2955 | +157 | +497 |
| % of Total | 47.80% | 49.43% | 49.66% | +8.04% | +9.67% |
| *Based on the number of AppExchange Apps available in the Business Need and Industry categories in May 2024, December 2024, and May 2025. | |||||
What are we seeing here?
- 5-star apps are still the most common among rated apps, but their share is slowly shrinking, even though the actual number of 5-star apps keeps increasing.
- Ratings in the 1–4 star range are also growing slowly, just not fast enough to change the bigger picture.
- The real shift? Unrated apps are rising fast. Nearly 500 more apps have no reviews or stars now compared to last year.
For developers, this is a wake-up call. A great product isn’t enough, you need adoption, reviews, and engagement to build trust on the AppExchange. And for users, it means many listings still feel like a black box.
Salesforce AppExchange in May 2025, Number of Reviews per App
Not all reviews carry the same weight. A single 5-star review might help a new app look polished, but it’s not the same as seeing dozens or hundreds of people vouch for a product. When we look at how many reviews AppExchange apps actually get, it’s clear that most apps don’t receive many at all.
Here’s the full breakdown as of May 2025:
| Breakdown of Salesforce AppExchange Apps in May 2025 by Number of Reviews per App | ||
| Number of Reviews | # of Apps | % of All Apps |
| 1000+ | 3 | 0.12% |
| 501–1000 | 8 | 0.31% |
| 101–500 | 79 | 3.05% |
| 11–100 | 376 | 14.53% |
| 6–10 | 168 | 6.49% |
| 1–5 | 582 | 22.49% |
| 0 | 1372 | 53.01% |
| *Based on the number of AppExchange Apps available in the Business Need and Industry categories in May 2025. | ||
What does this mean?
- Over half the apps on AppExchange still have zero reviews.
- Nearly a quarter of apps have five or fewer reviews, which usually isn’t enough to build credibility or surface in filtered searches.
- Only 79 apps total have more than 100 reviews.
- And just three apps have managed to pass 1,000 reviews, a tiny fraction of the ecosystem.
In a marketplace this large, social proof matters. Most users trust apps that have visible activity, especially when exploring niche tools or newer categories. For ISVs, it’s not just about launching, it’s about activating early users and turning them into advocates.
Top 10 Most Reviewed Apps on AppExchange – May 2025
Out of nearly 6,000 apps on AppExchange, only a small group has managed to break through the noise and earn a large number of user reviews. These apps typically fall into high-demand categories like e-signatures, messaging, CTI, or integrations, tools that are part of everyday Salesforce workflows.
Here are the 10 apps with the highest number of reviews as of May 2025:
| Top 10 Most Reviewed Salesforce Apps – May 2025 | ||||||
| # | App Name | Developer | Star Rating | Rounded Rating | Reviews | Developer’s Total Apps |
| 1 | Docusign eSignature for Salesforce | Docusign, Inc | 4.55 | ⭐⭐⭐⭐⭐ | 4645 | 4 |
| 2 | Adobe Acrobat Sign eSignatures for Salesforce | Adobe | 4.86 | ⭐⭐⭐⭐⭐ | 3198 | 3 |
| 3 | Cirrus Insight for Gmail | Cirrus Insight | 4.70 | ⭐⭐⭐⭐⭐ | 2094 | 2 |
| 4 | 360 SMS App for Salesforce Messaging | 360 Degree Cloud Technologies Pvt. Ltd. | 4.89 | ⭐⭐⭐⭐⭐ | 1237 | 10 |
| 5 | SMS Magic & Conversive – Conversational Messaging | Screen Magic Mobile Media | 4.81 | ⭐⭐⭐⭐⭐ | 1058 | 3 |
| 6 | Vonage for Service Cloud Voice and Contact Center | Vonage | 4.92 | ⭐⭐⭐⭐⭐ | 1010 | 4 |
| 7 | Geopointe: Maps, Routing & Territory Management | Ascent Cloud LLC | 4.90 | ⭐⭐⭐⭐⭐ | 928 | 4 |
| 8 | Conga Composer Salesforce Connector | Conga | 4.75 | ⭐⭐⭐⭐⭐ | 892 | 11 |
| 9 | Salesforce Adoption Dashboards | Salesforce Labs | 4.60 | ⭐⭐⭐⭐⭐ | 817 | 532 |
| 10 | Outlook Integration – Revenue Grid | Revenue Grid | 4.74 | ⭐⭐⭐⭐⭐ | 770 | 3 |
| *Based on the number of AppExchange Apps available in the Business Need and Industry categories in May 2025. | ||||||
What stands out?
- Every app on the list holds a rounded 5-star rating, which builds trust and signals consistent quality.
- Most top-reviewed apps are developed by independent vendors, not Salesforce. In fact, only one – Salesforce Adoption Dashboards, comes from inside the Salesforce ecosystem.
- Many of these apps solve “everyday” problems: signing documents, sending messages, syncing emails, or tracking activity.
You’ll also notice that having just a few apps doesn’t limit reach. Cirrus Insight and Revenue Grid only have 2–3 apps each, yet they’re among the most-reviewed on the entire platform.
If you’re looking for examples of what consistent product-market fit looks like, this is it.
You can also see how trends like AI and automation are influencing newer apps in our AgentExchange apps analysis March 2025 and AgentExchange apps analysis April 2025 roundups.
Pricing Trends on AppExchange
AppExchange isn’t just growing in size, it’s shifting in how apps are priced and positioned. While free tools are still widely available, the share of paid apps is rising. And more apps are now offering nonprofit discounts, which weren’t tracked consistently in earlier years.
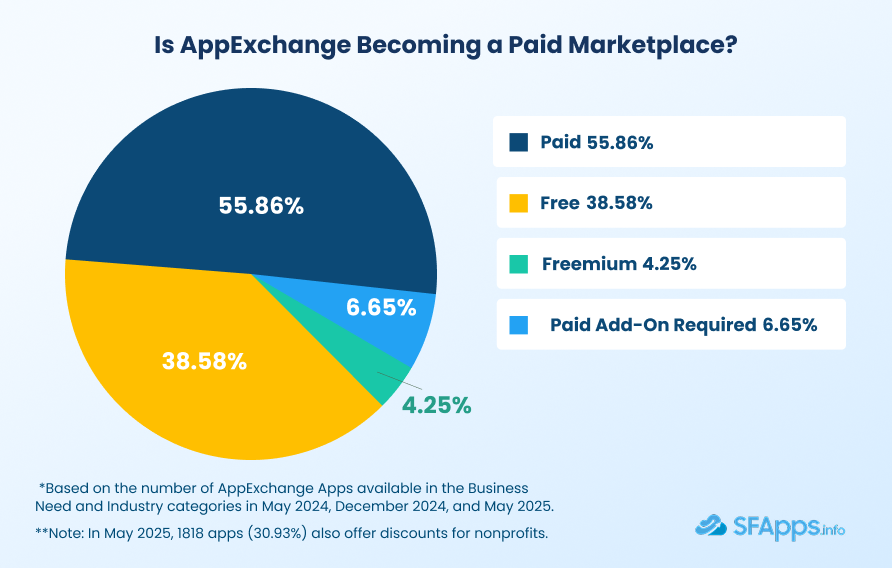
Here’s a comparison of app pricing types between December 2024 and May 2025:
| Shift in Pricing Trends on AppExchange in 6 months | |||||
| Pricing Model | Dec 2024 | % (Dec) | May 2025 | % (May) | Change in % |
| Free | 2223 | 39.27% | 2298 | 38.58% | -0.69% |
| Freemium | 237 | 4.19% | 253 | 4.25% | +0.06% |
| Paid | 3264 | 57.66% | 3327 | 55.86% | -1.80% |
| Paid Add-On Required | 369 | 6.65% | 396 | 6.52% | +0.13% |
| Apps Total | 5661 | 100% | 5956 | 100% | –295 apps |
| *Based on the number of AppExchange Apps available in the Business Need and Industry categories in May 2024, December 2024, and May 2025.**Note: In May 2025, 1818 apps (30.93%) also offer discounts for nonprofits. | |||||
What does this tell us?
- Paid apps are rising faster than free apps, which suggests a more mature, commercial developer base, and likely better feature sets and support.
- The freemium model is still underused, showing up in only 4.25% of listings, despite being one of the best strategies for building initial user trust.
- The return of nonprofit pricing transparency is a welcome sign for mission-driven orgs that rely on Salesforce but can’t always justify full license costs.
The AppExchange is clearly evolving toward more sustainable, value-based pricing, but free and discounted options still play an important role for adoption, especially in small and nonprofit teams.
Summary and Takeaways
The AppExchange marketplace has grown significantly over the past year. As of May 2025, it includes nearly 6,000 apps and over 3,600 active developers, a 15% increase in both areas compared to May 2024. However, while the volume of listings continues to rise, the quality of visibility and engagement isn’t growing at the same pace.
This analysis uncovers where meaningful change is happening and where the gaps still are. Below is a breakdown of the most important insights from the data.
Marketplace Growth is Steady but Uneven
Between May 2024 and May 2025:
- The number of apps increased by 809.
- The number of unique developers rose by 492.
- Review activity only grew by 5.7%, which is relatively low compared to the rise in listings.
This tells us that while more apps are being published, fewer are managing to generate traction. Getting listed is no longer enough – standing out requires a clearer go-to-market strategy, early user feedback, and active marketing.
Sales and Productivity Tools Still Lead the Way
Business needs haven’t shifted much. Sales continues to be the dominant category with 26% of all apps, followed by Productivity (15.6%) and IT/Admin tools (10.8%).
These three categories still reflect Salesforce’s core usage across CRM, reporting, and automation. On the other hand, underrepresented areas like Collaboration, Commerce, and ERP remain relatively small, which could signal opportunities for developers seeking untapped segments.
Industry-Focused Apps Are Growing, But Most Still Remain Broad
Just under half of all apps are tagged by industry. Of those:
- Over 49% target three or more verticals.
- Only 38% are focused on a single industry.
- Financial Services, Healthcare, and Retail are the three most saturated sectors.
What this suggests is that while industry focus is increasing, most apps are still designed for cross-vertical use. Meanwhile, areas like Nonprofit, Public Sector, and Energy remain underserved and may offer niche potential for ISVs.
Role-Based Design Reflects Salesforce’s Evolution
The majority of AppExchange apps are built for:
- Salesforce Administrators (18.5%)
- Business Operations Managers (17%)
- Sales Managers and Reps (16.2%)
These roles align with those most responsible for day-to-day CRM usage and configuration. However, there’s also noticeable growth in tools for Executives, Consultants, Marketers, and Developers, showing that app creators are beginning to support the broader Salesforce ecosystem, not just the technical side.
User Ratings: More Apps, Fewer Reviews
Review and rating activity remains one of the weakest points of the AppExchange experience:
- 49.66% of all apps have no rating at all.
- Only 3 apps have surpassed 1,000 reviews.
- Even the percentage of 5-star-rated apps dropped slightly, from 26.18% in 2024 to 25.93% in 2025.
Despite this, most apps that do receive reviews still average a high rating, often rounding to 5 stars. However, the lack of feedback across more than half the marketplace signals a serious discovery and trust issue, especially for newer or lesser-known tools.
Paid Listings Are Now the Majority
As of May 2025:
- 55.86% of apps are paid, down from 57.66% six months earlier.
- 38.58% of apps are free.
- Freemium listings remain rare at 4.25%.
- Nearly one-third of apps offer discounts to nonprofit organizations (May 2025).
This trend points to a more mature and monetized marketplace. However, the limited use of freemium models may be a missed opportunity, especially for new apps looking to build initial traction.
Final Thoughts
The AppExchange in 2025 is a more crowded and competitive space than ever before. For businesses, this means more choice, but also more research to find the right tool. For developers, it means releasing a product isn’t the finish line – it’s just the start.
Apps that stand out today are those that:
- Focus on clear, high-demand use cases
- Build trust through reviews and engagement
- Adapt to underserved industries or roles
- Have a pricing model that reflects value while remaining accessible
If you’re building or promoting an app, our marketing services for Salesforce apps can help get your solution in front of the right audience.

Dorian is a 6X Certified Salesforce Developer and Administrator with a start in the IT world as a CRM Admin in 2020. Since diving into Salesforce in 2021 via Trailhead and Focus on Force, he has achieved a Ranger Rank, earned several Superbadges, and bagged certifications including the Salesforce Certified Administrator, Platform App Builder, Associate and Platform Developer I by 2023. In 2024 he also became Salesforce Certified AI Associate and earned Certified AI Specialist Certification in 2025. Dorian is very keen on continuous learning, always looks for fresh ways to improve his knowledge. He enjoys running, boxing, kickboxing and reading diverse kinds of books in his free time.


 Previous Post
 Next Post