
The digital landscape of businesses today emphasizes the significance of metrics and indicators. Much like checking a patient’s pulse provides insights into their health, measuring customer service metrics reveals the vitality of a business. With a plethora of platforms and tools available, one solution stands head and shoulders above the rest – Salesforce.
The Vital Signs of Your Business
Understanding customer service metrics is not just about numbers, it’s about discerning the health and performance of your operations. The nuances found in these metrics play a pivotal role in molding customer loyalty and steering profitability. With tools like Service Cloud KPI Salesforce, businesses can harness these insights seamlessly, ensuring that they’re not just tracking data but making informed decisions based on it.
KPI-centric Customer Support Dashboard in Salesforce
Salesforce, a premier customer relationship management (CRM) solution, equips enterprises with a powerful interface to oversee customer engagements, encompassing support functionalities. For support squads, a daily dashboard spotlighting Key Performance Indicators (KPIs) is pivotal in tracking, evaluating, and refining the support journey.
How to Build a Customer Support KPI Daily Dashboard
Insight:
Preparation is the foundation of success.
- Identify Your Goals
Determine the main objectives of your support team. Are you focusing on quick resolutions, high customer satisfaction, or maybe reducing the ticket backlog?
- Select Relevant Metrics
Based on your goals, select the most relevant KPIs.
- Gather Data
Ensure that you have a system in place, like a CRM tool (e.g., Salesforce), to capture and store the required data.
- Choose a Dashboard Tool
While there are several out there, using the one integrated with your CRM or helpdesk software is generally more seamless. Tools like Tableau, or the native dashboard functionalities in platforms like Salesforce are useful. Salesforce is a comprehensive CRM platform that offers a suite of tools to create an effective customer support dashboard. Depending on your organization’s needs and size, certain tools might be more suitable than others.
Below are some of the most prominent Salesforce tools tailored for customer support dashboards:
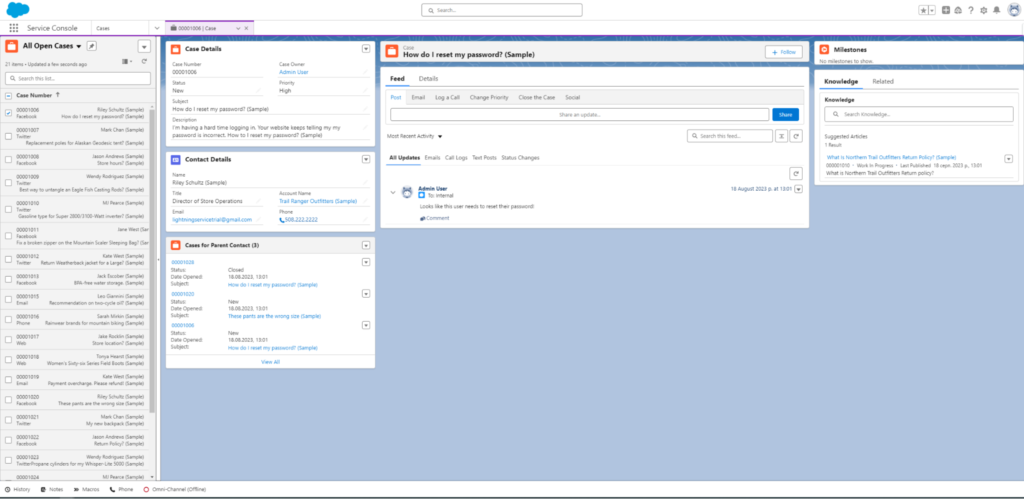
- Service Cloud
Positioned as Salesforce’s paramount tool for customer support, the Service Cloud has been engineered to effectively navigate all nuances of client engagement. Agents are empowered with an intuitive dashboard, shedding light on detailed customer profiles, which in turn fast-tracks problem resolution. Essential features encapsulated within the Service Cloud ecosystem include advanced case orchestration, a dynamic knowledge archive, and efficient automated channels for both web and email inquiries.
- Einstein Analytics (previously known as Wave Analytics):
A cloud-based data visualization tool to generate interactive visualizations and actionable insights.Helps in tracking support KPIs and other metrics in visually appealing charts and graphs.Uses AI to provide predictions, recommendations, and insights.
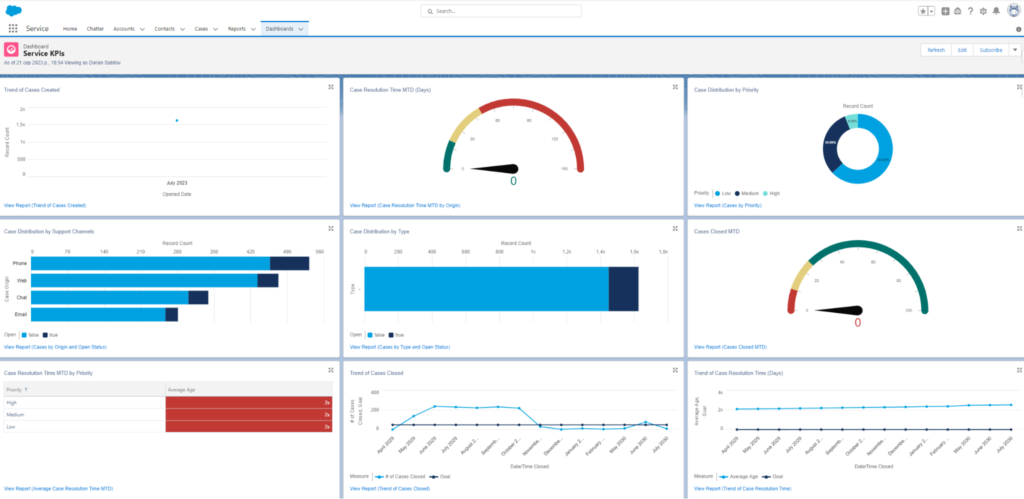
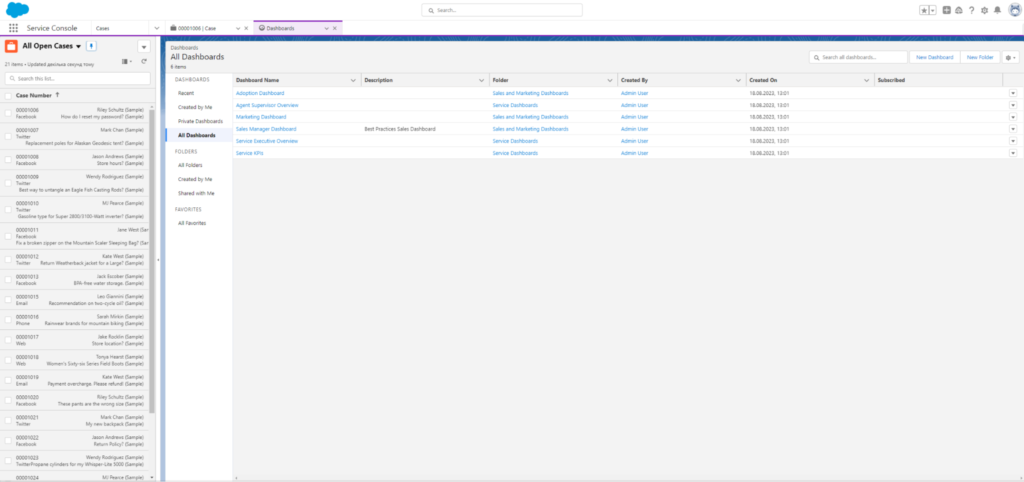
- Reports & Dashboards
Salesforce’s built-in feature, allows users to create customized reports and dashboards tailored to specific needs. With drag-and-drop functionalities, users can quickly visualize their data.
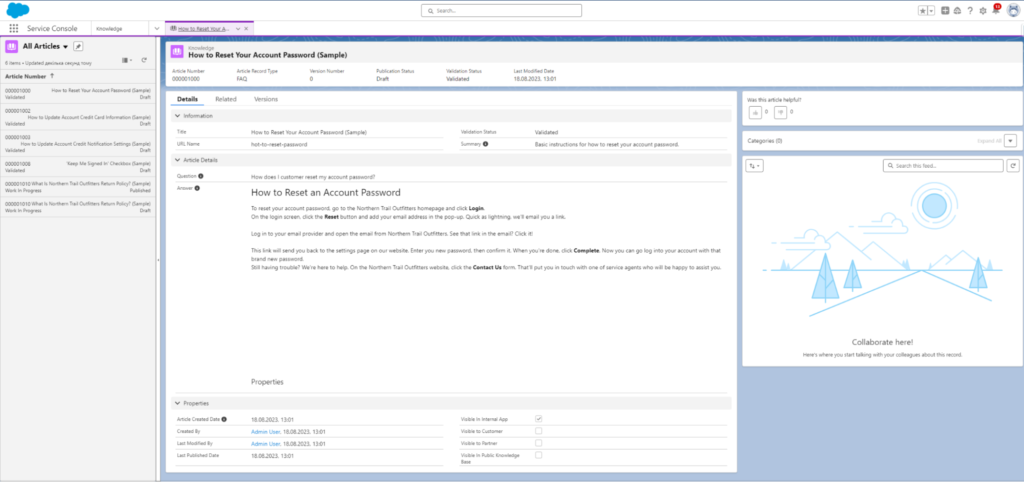
- Knowledge Base
A tool within Service Cloud that allows support teams to create and maintain articles, FAQs, and other documentation.
Can be used for both internal support agents and external customers.
- Omnichannel
Allows companies to manage cases and work items across multiple channels like email, phone, chat, etc. Offers an analytics-driven approach to distribution, ensuring high-priority tasks are routed to the right agent.
- AppExchange
Salesforce’s marketplace offers various third-party applications that can integrate with Salesforce for enhanced functionality. Some apps are specifically designed to enhance customer support functionalities and analytics.
Insight:
Once you’ve determined the ideal tool for your needs, you can proceed with constructing the dashboard.
- Design the Dashboard
Start with the most crucial metrics at the top or center. Ensure that the dashboard is visually appealing and easy to understand. Group similar metrics together. For example, all time-related metrics (like First Response Time and Average Resolution Time) can be grouped.
- Automate Data Flow
The dashboard should automatically pull in new data, ensuring that the metrics are always up-to-date.
- Review & Refine
As you use the dashboard, you may find that some metrics are more valuable than others, or you might discover new metrics that are important to track.
Periodically revisit and revise your dashboard to ensure it remains relevant.
Benefits of a KPI-Driven Dashboard:
- Real-time Insight: Dashboards provide an instant snapshot of where the support team stands concerning daily goals, customer inquiries, and overall efficiency.
- Prioritization: It helps in identifying critical issues or inquiries that need immediate attention.
- Performance Tracking: Over time, monitoring KPIs can help ascertain the effectiveness of different strategies, tools, and personnel.
Essential Metrics for Your Customer Support Dashboard
- Inquiry Count
Monitors the total number of new support requests or issues. These can be segmented further based on the nature or classification of the problem.
- Initial Response Duration
Reflects the time taken by an agent to provide the first reply to a customer’s concern or issue. Extended durations may suggest inefficiencies in the support process or an overwhelming ticket count. If there’s an existing customer service level agreement, ensure that the initial response aligns with the stipulated timeline in the agreement.
- Mean Resolution Duration
This represents the average time required to address and settle an issue once reported.
- Customer Feedback Score (CFS)
Derived from post-interaction evaluations, it gauges customer contentment with the support rendered. Obtain this metric by circulating customer feedback forms, prompting them to rate their latest support interaction. For deeper insights, incorporate open-ended queries urging customers to elucidate their experiences. A prompt like, “Suggestions for enhancement?” can reveal areas needing refinement.
- Pending Ticket Count
Denotes the total number of tickets awaiting resolution. It’s crucial for resource planning and may signal if there’s a need for enhanced staff training or additional recruitment. This can also be stratified by the age of the ticket (e.g., 1 day, 1 week).
- Single Interaction Resolution (SIR)
Denominates the fraction of issues settled in the maiden interaction, eliminating the requirement for subsequent follow-ups. An elevated SIR usually signifies proficient and prompt support.
- Engaged Support Staff
Showcases the total count of support representatives actively addressing tickets. Vital for human resource allocation, especially during high-demand intervals. A substantial count can hint at intricate issues requiring exhaustive resolution efforts or potential issues within your product or knowledge reservoir.
- Problem-Solving Duration
Time taken by a support representative to rectify an issue. Quick solutions are paramount to a stellar customer service experience. Scrutinize this metric for patterns across diverse customer issues and among individual agents, which can highlight areas needing improvement or further agent training.
- Resolution Count
A daily target of resolved tickets (e.g., 15) is often set for support agents. Using this benchmark, evaluate the performance of agents and teams through the percentage of targets met. Analyzing this over a set duration, like 30 days, can unearth trends in performance and staffing requirements. This is evaluated by taking the sum of tickets addressed in the past 30 days and dividing it by an estimated 18 workdays a month.
- Elevation Percentage
Represents the fraction of tickets that necessitated redirection to superior support tiers or leadership.
Setting Up Your Dashboard in Salesforce
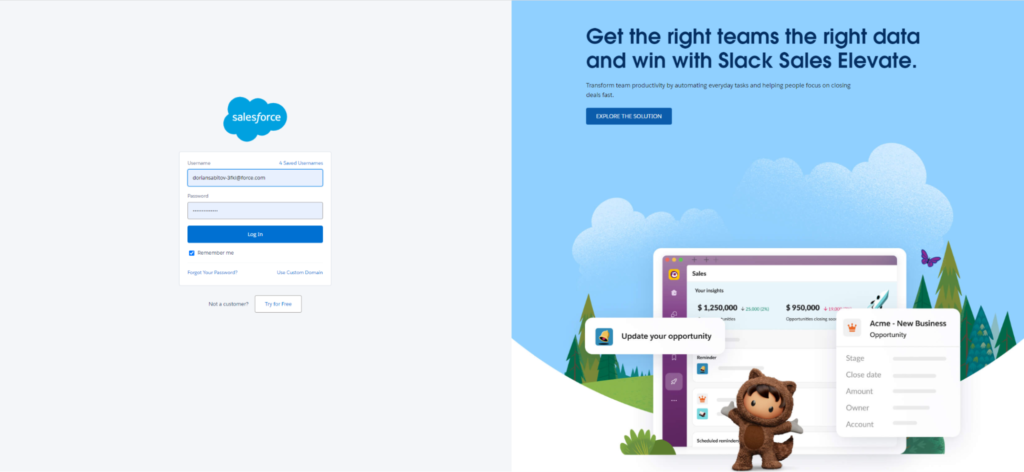
1. Login to Salesforce:
Ensure you have the necessary permissions to create and modify dashboards.
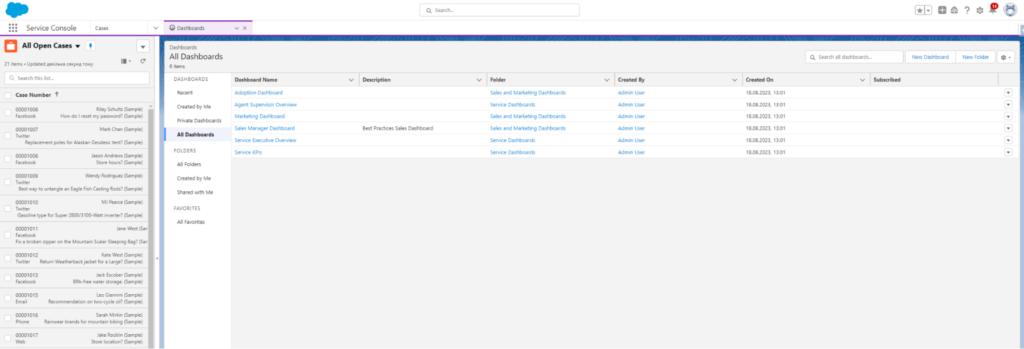
2. Navigate to Dashboards:
From the App Launcher, select Dashboard.
3. Create New Dashboard:
Click New Dashboard and name it, for instance, “Daily Support KPIs”.
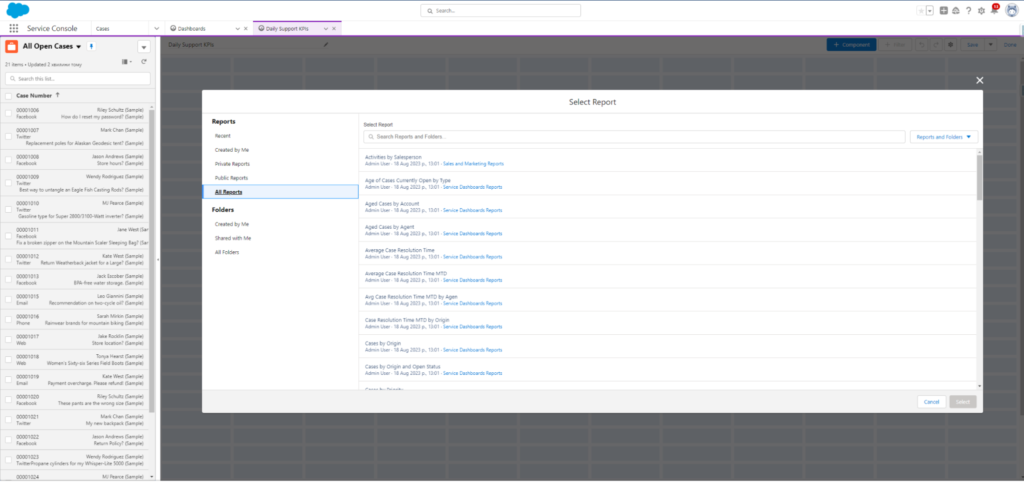
4. Incorporate Elements:
Based on your Salesforce Organization setup, data can be extracted from various reports. For each designated KPI, it’s standard to formulate a related report and subsequently integrate it into the dashboard as a distinct element.
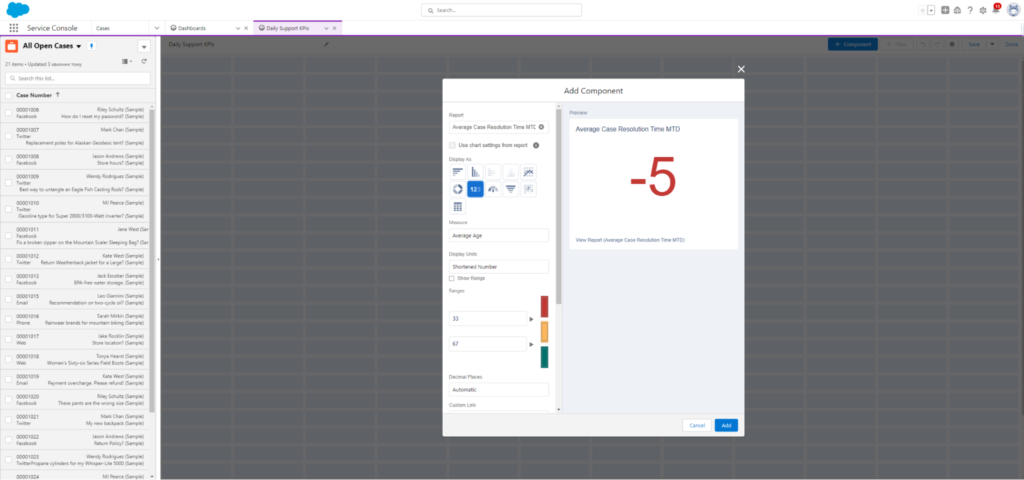
5. Customization:
Salesforce offers various types of components (e.g., charts, tables, metrics) that can be customized to display your data the way you want.
6. Sharing and Access:
Once the dashboard is ready, set its visibility and sharing settings. Ensure that it’s accessible to the relevant members of your support team.
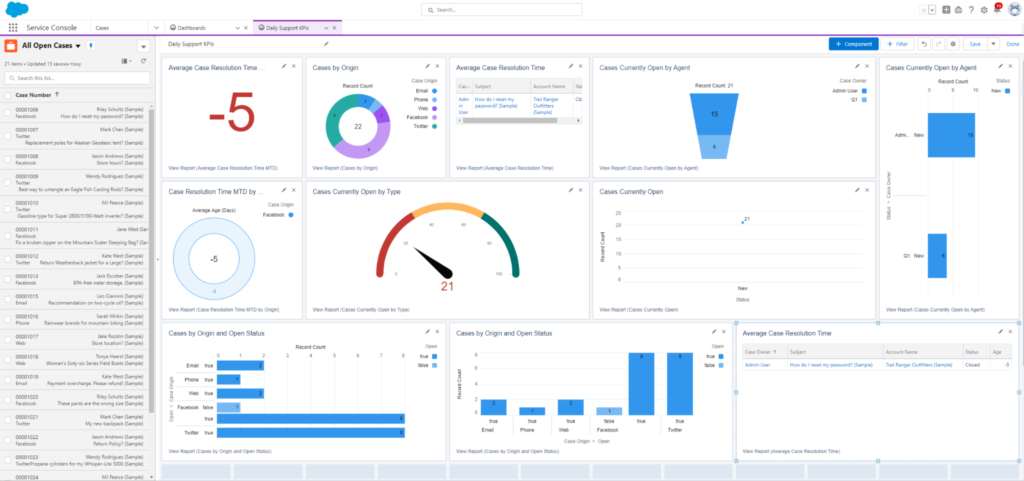
7. Daily Review: Motivate team members to habitually engage with the dashboard daily. Frequent discussions anchored on these metrics can stimulate an ethos of continual progress.
FAQs on Custom Customer Service Agent KPI Dashboard in Salesforce
How do I utilize Salesforce Service Cloud Dashboards to Enhance Customer Service Agent Performance?
Salesforce Service Cloud dashboards are powerful tools for monitoring and enhancing customer service agent performance. To effectively use these dashboards, you should include components that track key performance indicators (KPIs) such as average handling time, first contact resolution rate, case closure rates, and customer satisfaction scores. Customize the dashboard to display real-time data so managers can quickly identify trends, bottlenecks, and areas needing improvement. Additionally, consider integrating leaderboards to foster healthy competition among agents and set up alerts for managers when performance metrics fall below certain thresholds. These practices not only help in monitoring performance but also motivate agents to improve their productivity and service quality.
What are the different Salesforce support tiers available?
Salesforce offers several support tiers to cater to different business needs and budgets:
- Essential Support: Provides basic access to support resources, including online documentation, webinars, and community support, suitable for small businesses or those just starting with Salesforce.
- Standard Support: Includes everything in Essential Support plus 24/7 toll-free support, online case submission, and a two-day response time, designed for businesses requiring a bit more assistance.
- Premier Support: Offers more comprehensive support features, including 24/7 phone support, faster response times, on-demand training, and access to success resources. This tier is ideal for businesses that rely heavily on Salesforce for their operations.
- Premier Plus Support: Adds developer support and administrative services to Premier Support, providing the most extensive support available, suitable for large enterprises or those using Salesforce at scale. Each tier is structured to meet different levels of need, ensuring that businesses can select a support plan that best fits their requirements and budget.
How can I leverage Salesforce Service Cloud reports and dashboards to monitor support performance?
To leverage Salesforce Service Cloud reports and dashboards effectively, start by customizing your reports to track specific metrics that are critical for assessing support performance, such as ticket volume, resolution time, customer feedback, and agent efficiency. Utilize the built-in report and dashboard creation tools in Salesforce to generate visual representations of these data points. Set up scheduled reports for ongoing analysis and ensure dashboards are accessible to key stakeholders and team leads. By regularly reviewing these reports and dashboards, you can gain insights into trends, identify areas for improvement, and make data-driven decisions to enhance your support services.
What measures should I implement to improve Salesforce support response time?
Improving Salesforce support response time can significantly enhance customer satisfaction. Implement the following measures:
- Optimize Workflow Rules: Use Salesforce’s workflow rules to automate certain processes such as ticket routing and escalation. This helps ensure that tickets are quickly directed to the appropriate agents without manual intervention.
- Implement Knowledge Base: Develop a comprehensive knowledge base and make it accessible both to customers and support agents. This can reduce the number of incoming queries and help agents resolve issues more quickly.
- Train and Equip Your Team: Regular training and updates on the latest tools and best practices can prepare your agents to handle queries more efficiently. Also, consider tools that aid in faster data retrieval and communication within the team.
- Monitor and Analyze Performance: Regularly monitor agent performance and response times using Salesforce reports and dashboards. Identify patterns and areas where delays occur and address these issues directly.
- Feedback Loop: Establish a feedback loop with customers to continuously improve response strategies based on customer experiences and expectations. By implementing these measures, you can streamline your response processes, thereby reducing wait times and improving overall customer service efficiency.
In Conclusion
For department heads, a customized daily dashboard in Salesforce, embedded with relevant KPIs, stands as a crucial instrument in guiding customer support teams to achieve their best. The true power of this tool isn’t merely in its structure but in its utilization — consistent monitoring, team-based discussions, and adaptive modifications based on these insights are bound to enhance customer interactions and amplify team performance.

Dorian is a 4X Certified Salesforce Developer and Administrator with a start in the IT world as a CRM Admin in 2020. Since diving into Salesforce in 2021 via Trailhead and Focus on Force, he has achieved a Ranger Rank, earned several Superbadges, and bagged certifications including the Salesforce Certified Administrator, Platform App Builder, Associate and Platform Developer I by 2023. Dorian is very keen on continuous learning, always looks for fresh ways to improve his knowledge. He enjoys running, boxing, kickboxing and reading diverse kinds of books in his free time.


 Previous Post
 Next Post
Excellent work, and a very informative piece. Thank you!