


Tableau Overview
Tableau Next (agent-powered analytics) is a powerful Salesforce App that empowers users to gain actionable insights through live visualizations, facilitating unlimited data exploration. Its interactive dashboards provide a dynamic platform for uncovering hidden insights on the fly, seamlessly connecting to various data sources, whether they are big data, SQL databases, spreadsheets, or popular cloud applications.

With Tableau Next, complex data can be easily transformed for analytics, enabling detailed insights. Users can represent data using various visualizations such as charts, pies, tables, graphs, plots, and maps, making it easy to understand and extract valuable information for data-driven decision-making.
Beyond its visualization capabilities, Tableau Next enables advanced data analysis with ease. Users can construct complex calculations using existing data, add reference lines and forecasts, and perform statistical analyses like trend analyses, regressions, and correlations. This helps convey insights and gain a deeper understanding of the statistical relationships within the data.
Additionally, Tableau Next streamlines the data preparation process within organizations. With its visual and direct approach to combining, shaping, and cleaning data, analysts and business users can quickly jumpstart their analysis using intuitive data preparation tools. This efficiency allows users to focus more on analysis and less on data wrangling.
Tableau Next empowers individual users and supports scalable Salesforce analytics software across the entire organization. Its flexibility allows users the freedom to explore data in a trusted environment without predefined constraints. This democratization of data enables everyone to unlock the full potential of the data, driving informed decision-making and fostering a data-driven culture throughout the organization.
The platform’s user-friendly interface and intuitive dashboards require minimal training, making it accessible to users of all skill levels. Furthermore, Tableau’s exceptional data visualization and analysis capabilities offer special reports for deep data analysis, facilitating informed decisions within organizations.
In summary, Tableau Next is a robust BI reporting tool that allows for analyzing and visualizing large volumes of data. Its powerful features, such as AI and ML functionality, enhance data analysis capabilities, making it a valuable asset in the data analytics landscape. With Tableau, organizations can empower data-driven decisions, fuel growth, and gain a competitive edge in today’s data-driven world.
Set Up Tableau in a Few Steps
Step 1 – Click the “Get It Now” button, and move forward thru the installation instructions.

Step 1.1 – Register your account.
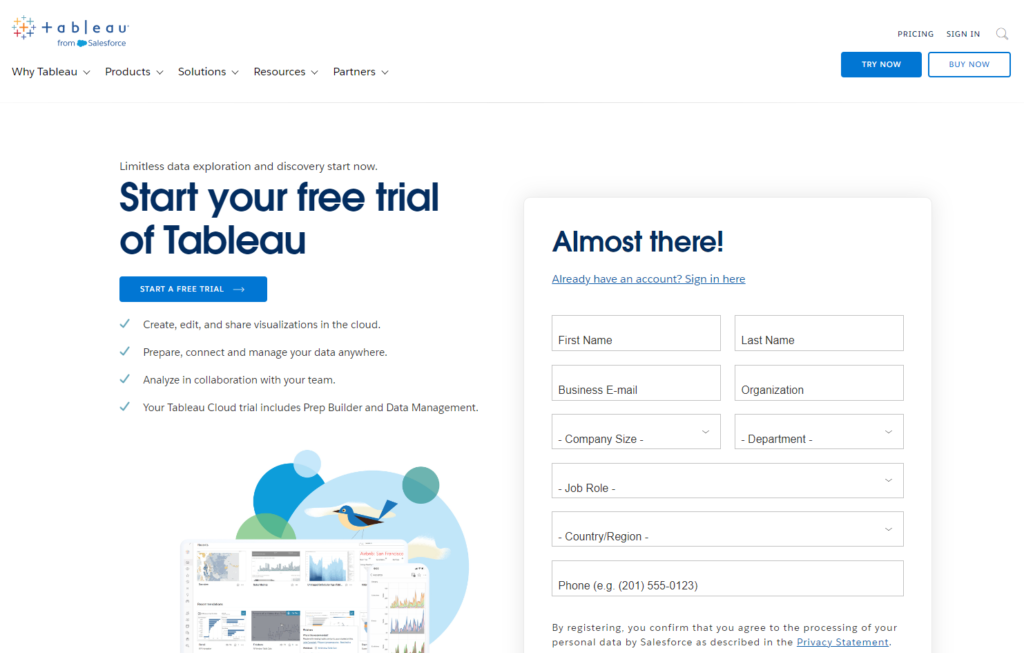
Step 1.2 – Confirm your registration.

Step 1.3 – Check your email and click the link for Activation.

Step 2 – Activate the Product.
Step 2.1 – Create a password.

Step 2.2 – Sign In with a new password.


Step 3 – Embark on your journey of exploration with Tableau.

Step 3.1 – Connect your Salesforce Org to Tableau.

Step 3.2 – Homepage of your Tableau site.

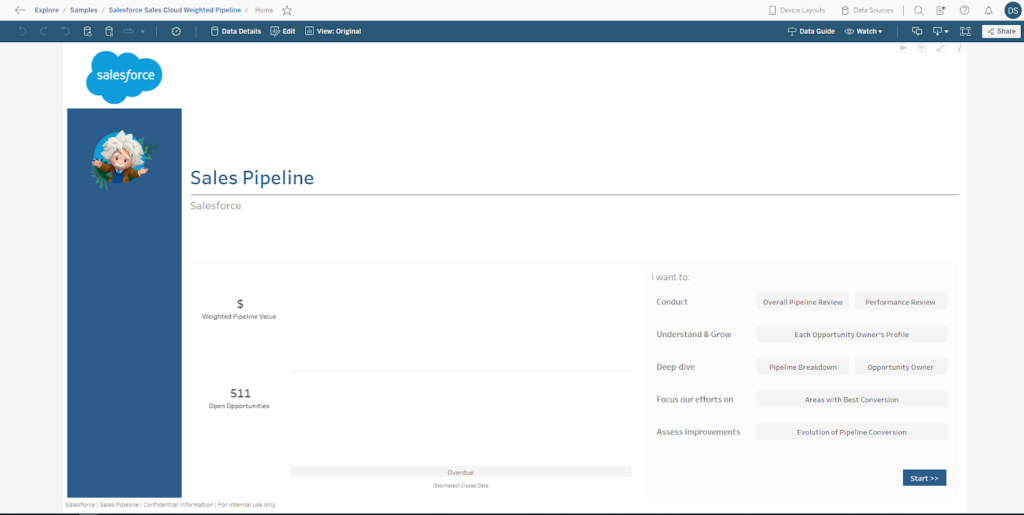
Step 4 – You can start with a prebuilt solution, just select the source of data you would like to work with.

Step 4.1 – Choose an example to work with.

Step 4.2 – Follow the steps and create a workbook with Data from your Salesforce Org.

Step 4.3 – Connect with Salesforce Org.

Step 4.4 – Allow Access to Salesforce.

Step 4.5 – New workbook based on Data from Salesforce Org.


Step 5 – You can create your own project, flow, and workbook from scratch.


Step 6 – Explore a lot of views such as Global Temperatures, Flight Delays, Customers, Economy, etc.

Insight:
There are a lot of preinstalled and specialized tools for business needs.,

Insight:
You should pay attention to:
- Cost: Tableau is a robust solution with a pricing structure that may not suit everyone. Some users might feel that the cost outweighs the benefits, especially if they have limited data analysis needs or a constrained budget.
- Data Preparation: While Tableau excels in data visualization and analytics, its data preparation capabilities are relatively limited compared to dedicated data preparation tools. Handling tasks like cleaning, transforming, and wrangling large or complex datasets within Tableau can sometimes be cumbersome.
- Native Data Connectors: Tableau supports a wide range of data connectors, but niche or specialized data sources may lack native connectors. This could require workarounds or custom development to integrate specific data sources into Tableau.
- Adaptation Period: Tableau is designed to be intuitive, but individuals with limited background in data visualization and analysis may find it challenging initially. Navigating Tableau dashboards and managing intricate calculations can be particularly daunting for beginners.
- Marketing: Tableau promotes its cloud version effectively, but many advanced formatting and visual settings are available only in the desktop version.
- Training and Learning: Tableau’s training typically requires a paid subscription, unlike Salesforce’s “Trailhead,” which offers free options. Additionally, the training primarily focuses on the desktop version, with less emphasis on the cloud version.
- Performance: Tableau’s performance may suffer when handling large datasets, resulting in slow and unwieldy experiences that impact user productivity.
- Limited Mobile Support: While Tableau provides mobile capabilities, some users may find the mobile experience less feature-rich compared to the desktop version.
It’s essential to recognize that these limitations don’t necessarily make Tableau a negative choice, as its benefits often outweigh the drawbacks for many users. However, careful evaluation of an organization’s specific needs and requirements is crucial before selecting a data visualization tool to ensure the best value and fit.
Top 5 FAQs about Tableau
What is Tableau, and what is it used for?
Tableau is a powerful data visualization tool used for converting raw data into easily understandable visual formats like graphs, charts, and dashboards. It helps users analyze, understand, and present data insights clearly and effectively, making it useful for business intelligence, data analysis, and reporting.
Can Tableau connect to different types of data sources?
Yes, Tableau supports connections to a wide variety of data sources including Excel, Google Sheets, SQL databases, cloud platforms (such as AWS, Google BigQuery), and more. It also allows users to connect to live data or use extracts for faster performance.
What is Tableau Prep, and how is it different from Tableau Desktop?
Tableau Prep is a tool within the Tableau ecosystem designed for data preparation. It allows users to clean, combine, and shape data before analysis. Tableau Desktop, on the other hand, is focused on creating visualizations and dashboards. Tableau Prep helps ensure that the data is ready for analysis in Tableau Desktop.
Is Tableau suitable for non-technical users?
Yes, Tableau is designed with an intuitive interface that allows even non-technical users to create visualizations and dashboards without deep programming knowledge. Its drag-and-drop features make it accessible to a broad range of users, though advanced features can be leveraged by more technical users.
What are Tableau Dashboards, and how do they work?
Tableau Dashboards allow users to display multiple visualizations on a single screen, providing a comprehensive view of the data. They enable users to interact with the data in real-time, drill down into specific details, and gain insights from different perspectives. Dashboards can be shared across teams or embedded in websites for broader accessibility.
Conclusion
Tableau boasts an intuitive and user-friendly interface, designed for clarity and efficiency. From the moment you start using it, you’ll be impressed by its minimalist design and easy-to-use commands. Navigating the program is seamless, enabling users of all skill levels to create stunning visualizations without a steep learning curve.
With Tableau, users can dive deep into their data and effortlessly uncover valuable insights and meaningful information.
Tableau presents a wide array of display possibilities, catering to various needs, whether it’s showcasing statistics to stakeholders, creating interactive dashboards, or crafting captivating infographics. The platform offers a diverse range of visualization options, including standard charts, diagrams, maps, scatter plots, and treemaps, among others, providing endless opportunities to visually communicate data in a compelling and meaningful manner.
Furthermore, Tableau’s dynamic capabilities empower users to actively engage with their data, allowing them to explore specific numbers, remove unnecessary information, and adjust visualizations on the fly. This interactive environment facilitates real-time exploration, enabling users to ask questions and receive instant answers, fostering a more exploratory and collaborative approach to data analysis. Additionally, Tableau’s ability to connect with real-time data sources ensures that your visualizations remain up-to-date, providing you with the most current insights at all times.
Insight:
According to the statistics, it is evident that Tableau stands as one of the top-notch solutions available in the market.

Dorian is a 6X Certified Salesforce Developer and Administrator with a start in the IT world as a CRM Admin in 2020. Since diving into Salesforce in 2021 via Trailhead and Focus on Force, he has achieved a Ranger Rank, earned several Superbadges, and bagged certifications including the Salesforce Certified Platform Administrator, Platform App Builder, Platform Foundations and Platform Developer by 2023. In 2024 he also became Salesforce Certified AI Associate and earned Agentforce Specialist Certification in 2025. Dorian is very keen on continuous learning, always looks for fresh ways to improve his knowledge. He enjoys running, boxing, kickboxing and reading diverse kinds of books in his free time.
 Previous Post
 Next Post
2 Responses to “Tableau App Review – Make Better Decisions with Live Analytics”