Overview
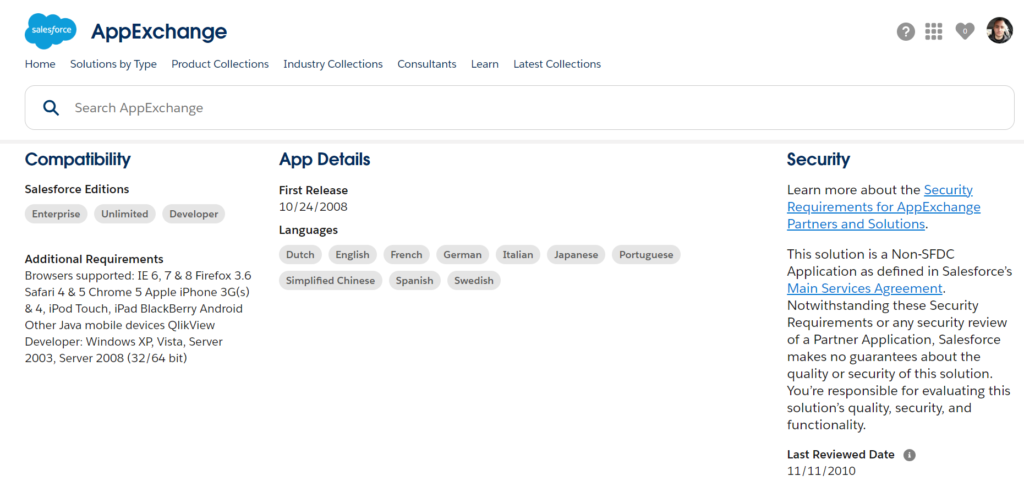
QlikView for Salesforce is a cutting-edge business analysis application tailored to enable user-driven CRM analysis at the speed of today’s dynamic business environment. This powerful tool offers a faster, more robust, and intuitive approach to transforming Salesforce data and external data into meaningful analysis, interactive dashboards, and insightful reports. Whether accessed as a custom tab within Salesforce or embedded as QlikView graphs, tables, and charts in other Salesforce tabs, QlikView ensures seamless data access even offline. Companies seeking to enhance analytics, visibility, and collaboration can easily integrate QlikView for various business benefits:
- Drive Sales Efficiency and Effectiveness: Unleash higher levels of sales productivity and effectiveness through comprehensive CRM analysis facilitated by QlikView.
- Measure Pipeline Trends: Gain valuable insights into pipeline trends across the entire sales cycle, empowering informed decision-making.
- Analyze Customer Service Requests: Delve into customer service requests across multiple dimensions to improve service delivery.
- Correlate Marketing Campaign Effectiveness: Connect marketing campaign effectiveness with sales activities for more targeted strategies.
- Identify Cross-Sell and Up-Sell Opportunities: Uncover cross-sell and up-sell opportunities within your customer base, maximizing sales potential.
By harnessing the power of QlikView for Salesforce, businesses can optimize customer interactions, make data-driven decisions, and seize every sales opportunity, ensuring your CRM data is transformed and presented in the most impactful and actionable manner.
Key Features
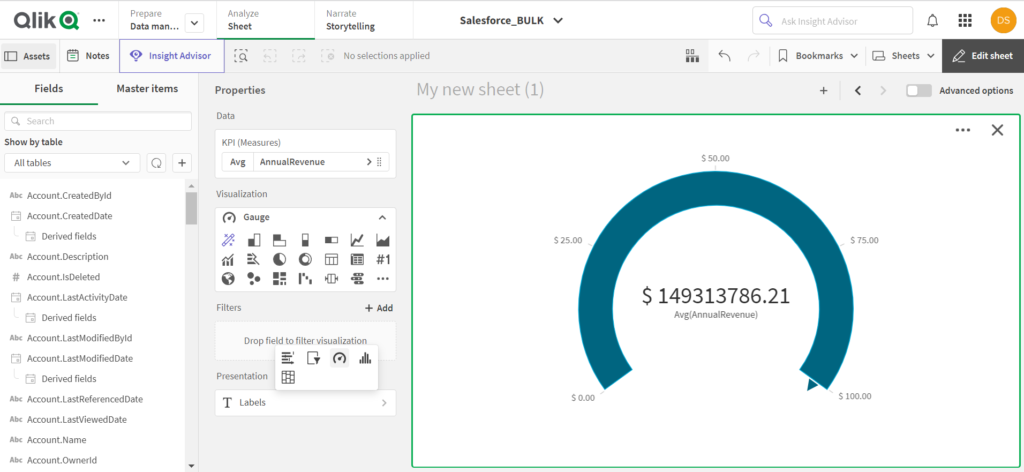
- AI-Powered Insights: Qlik Sense elevates human intuition with AI-powered insight suggestions and natural-language interactions, making data analysis more intuitive and efficient.
- Supporting Digital Transformation: As businesses undergo digital transformation and automation, Qlik Sense stands as a reliable analytics partner, meeting a wide array of analytics needs.
- Scalable, Flexible, and Automated Methodology: Qlik Sense boasts a scalable, flexible, and automated approach to deployments, ensuring cost-effectiveness regardless of the size of the analytics investment.
Advantages of QlikView
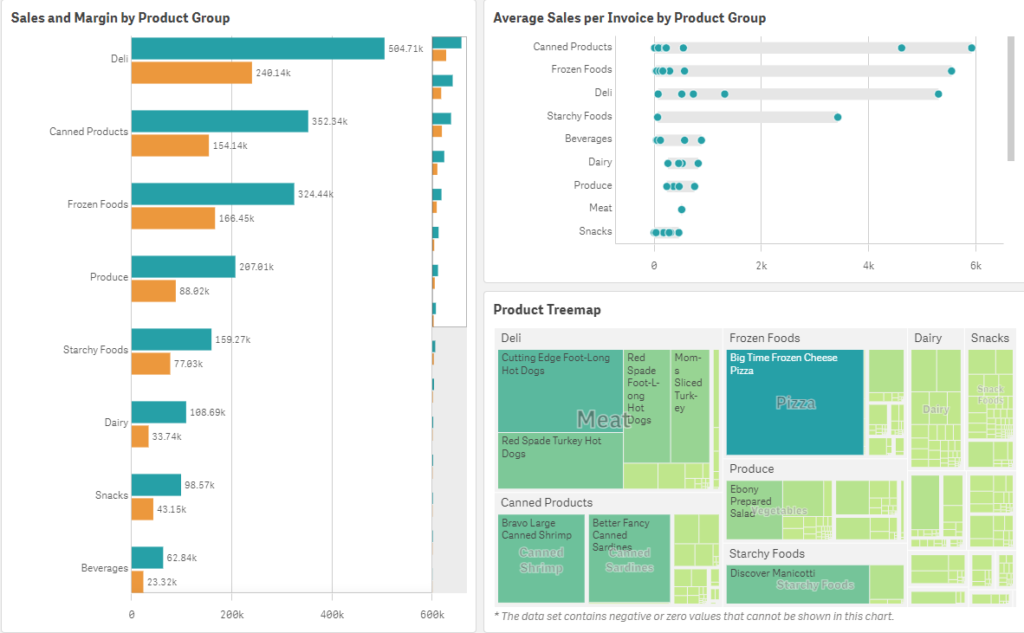
- Dynamic Dashboards and Collaboration: QlikView offers dynamic dashboards that provide diverse views of data sets, enabling users to gain deeper insights from multiple perspectives. Additionally, the platform supports seamless data sharing and team collaboration, promoting a collaborative data-driven culture within organizations.
- User-Friendly for All: QlikView is designed to cater to both tech-savvy users and non-tech individuals. Its user-friendly interface allows non-technical users to efficiently work with the tool without the need for extensive assistance, streamlining data analysis processes for all users.
- Easy Maintenance and Cost-Effective Licensing: The platform ensures hassle-free maintenance, reducing the burden on IT teams. Moreover, QlikView’s multiple user licenses are reasonably priced, making it a cost-effective choice for organizations of various sizes.
- Enhanced Data Segregation: Selection and highlight features in QlikView offer convenient ways to segregate data sets, facilitating clearer data analysis and interpretation.
- Efficient Data Compression: QlikView’s data compression feature optimizes output files, making them less bulky and easier to manage.
- Versatile Dashboard Design and Scripting Automation: QlikView’s user-friendly dashboard design comes with a plethora of charts and graphs, allowing users to create compelling data presentations. Additionally, the scripting option enables the automation of various tasks within the dashboard, enhancing efficiency and saving time.
- Intuitive Interface and Accessible Anywhere: The platform’s interface resembles Excel, providing a familiar environment for users to organize columns and filter data. Accessible via any browser, QlikView allows users to swiftly retrieve graphs, charts, or raw data for comprehensive analysis, anytime and anywhere.
- Robust Platform for Large-Scale Data Management: QlikView excels in managing data intake at a large scale without any lag. Its inbuilt ETL feature further enhances data processing capabilities, making it a comprehensive tool for data management.Empowering Agile and Statistical Functionalities: QlikView supports agile and statistical functionalities, empowering users to visualize patterns and gain modern insights crucial for business growth. The platform also implements a transformation of files, converting various information sources into useful data for collaborative processes, eliminating any potential errors in users’ fields of work. Once users grasp the essential concepts, QlikView becomes an easy-to-use platform for harnessing data-driven intelligence.
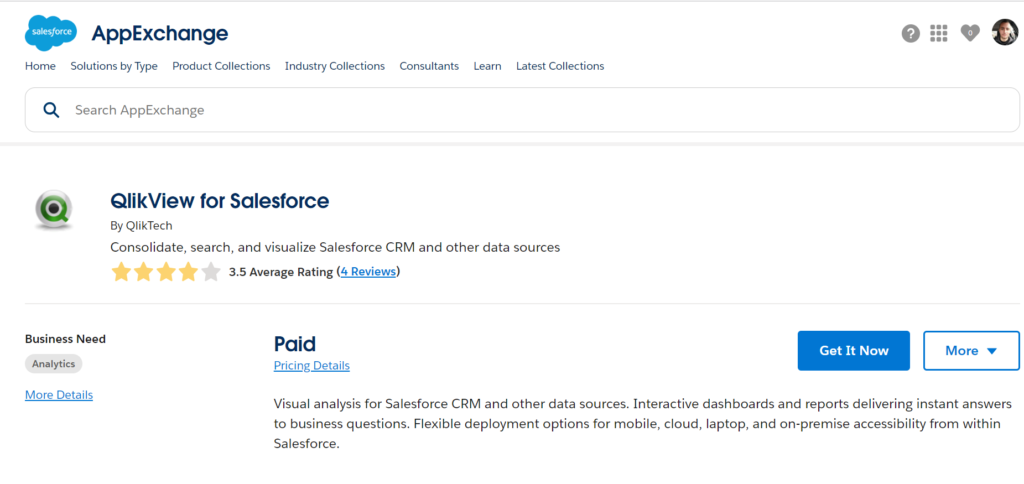
Simple Set Up Steps for QlikView
Step 1 – find in AppExchange Market an App. Then click Get It Now and follow the instructions.
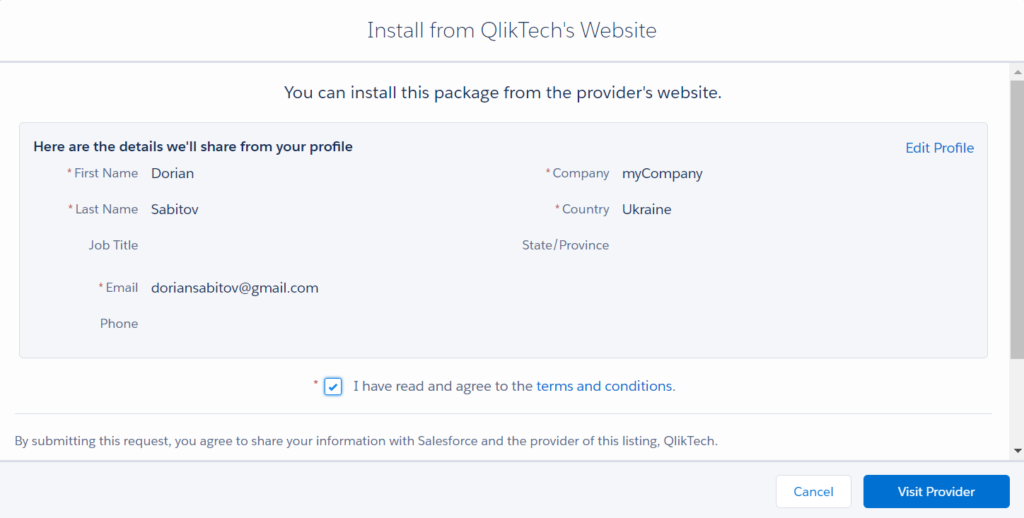
Step 1.1 – Accept to install an App from the Website.
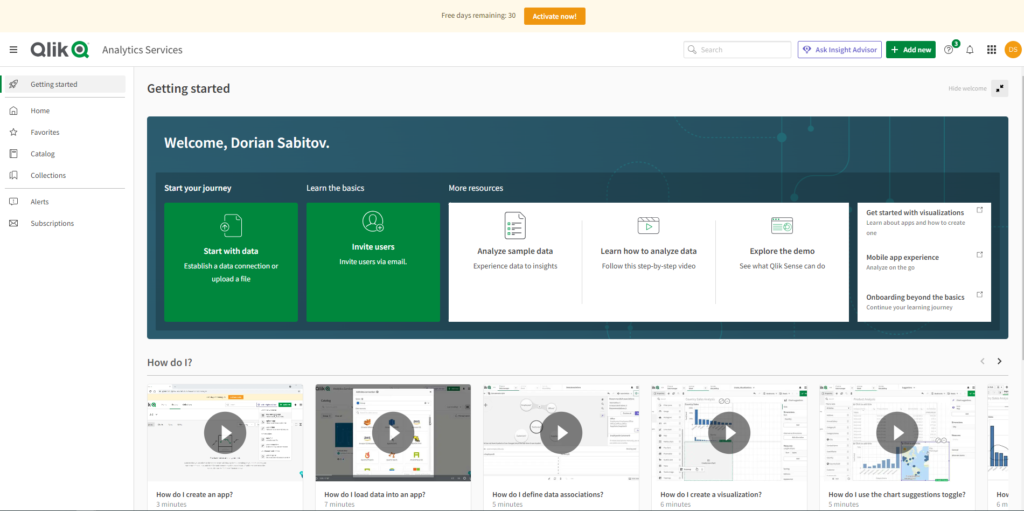
Step 1.2 – Explore a Home Page.
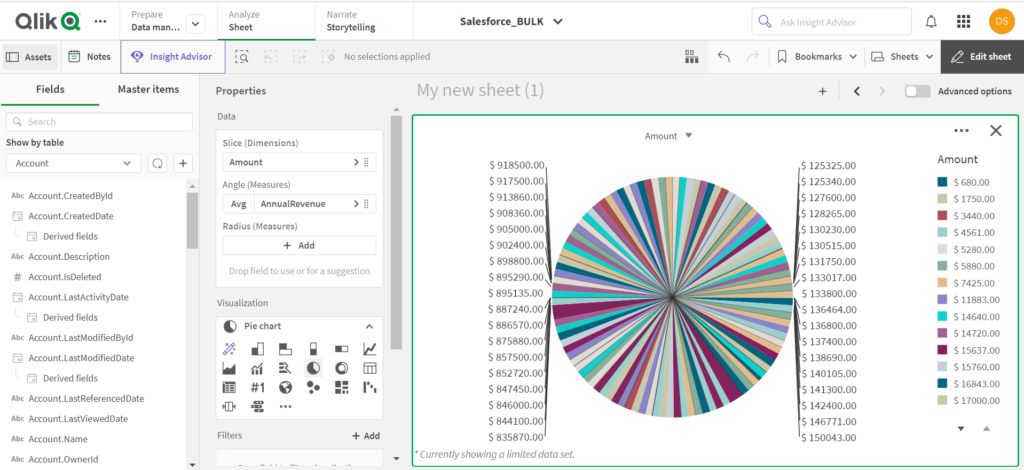
Step 2 – Choose a source, from where you would like to extract a Data.
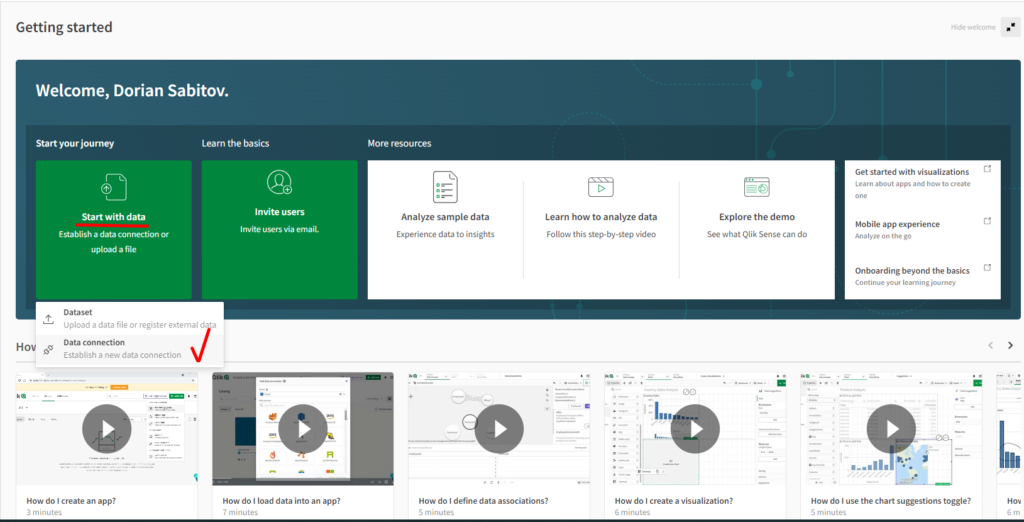
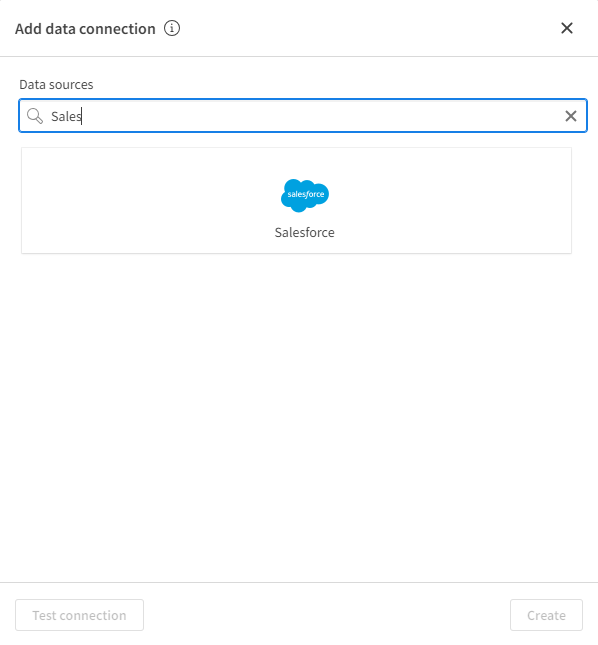
Step 2.1 – Choose Salesforce.
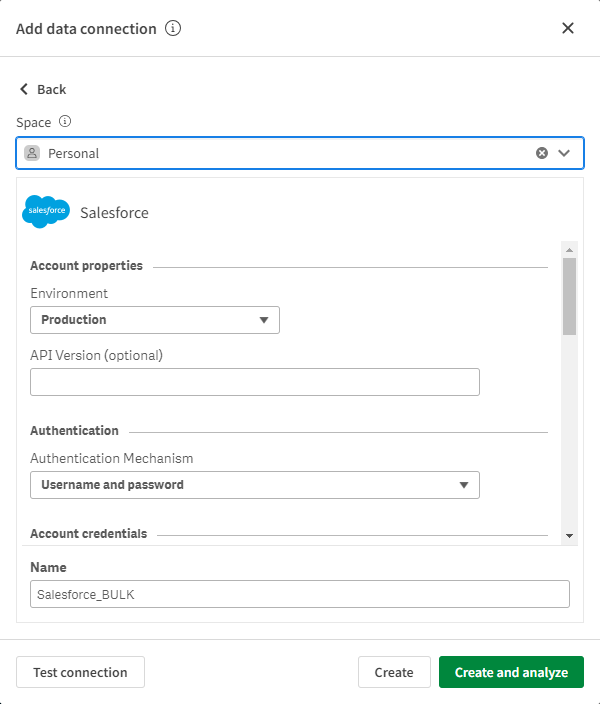
Step 2.2 – Set Up a Connection
Insight:
To get a connection between Salesforce Org with QlickView, you will need a Security Token, prepare it beforehand.
Step 2.3 – Specify the Data you will work with.
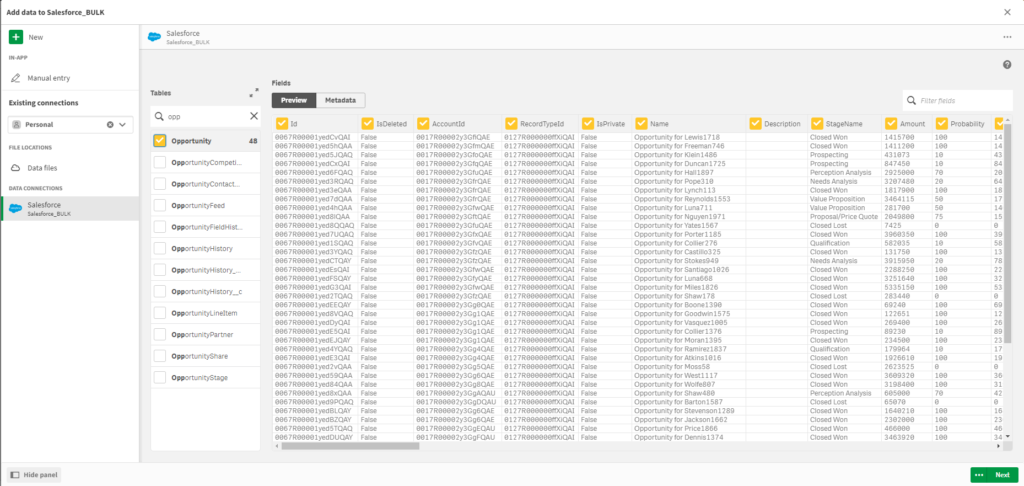
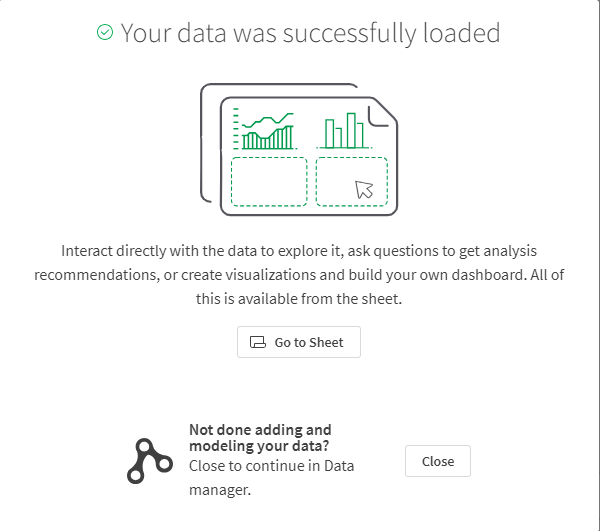
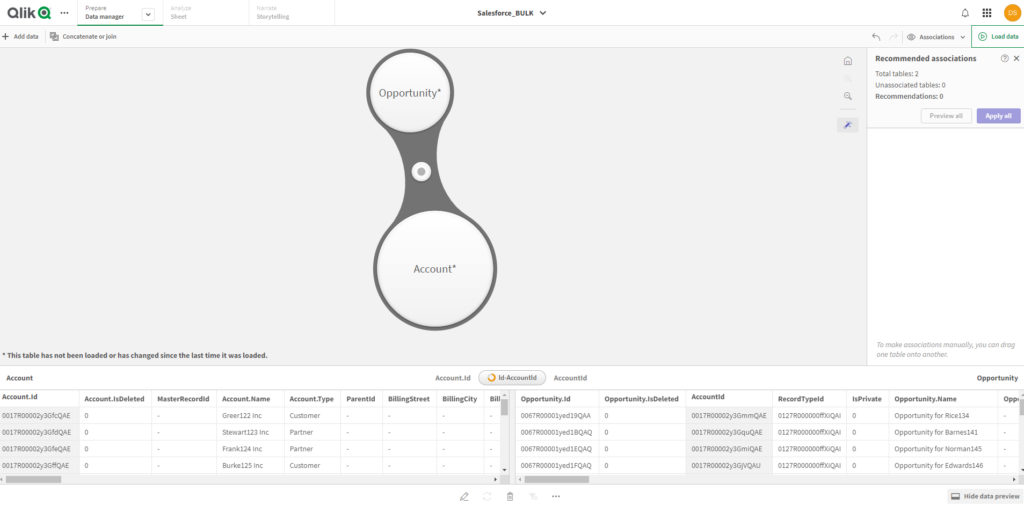
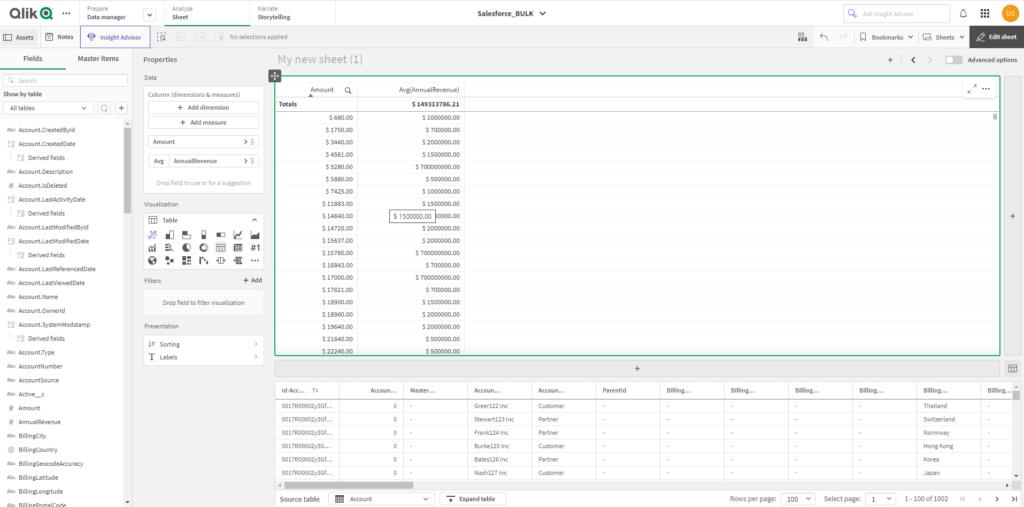
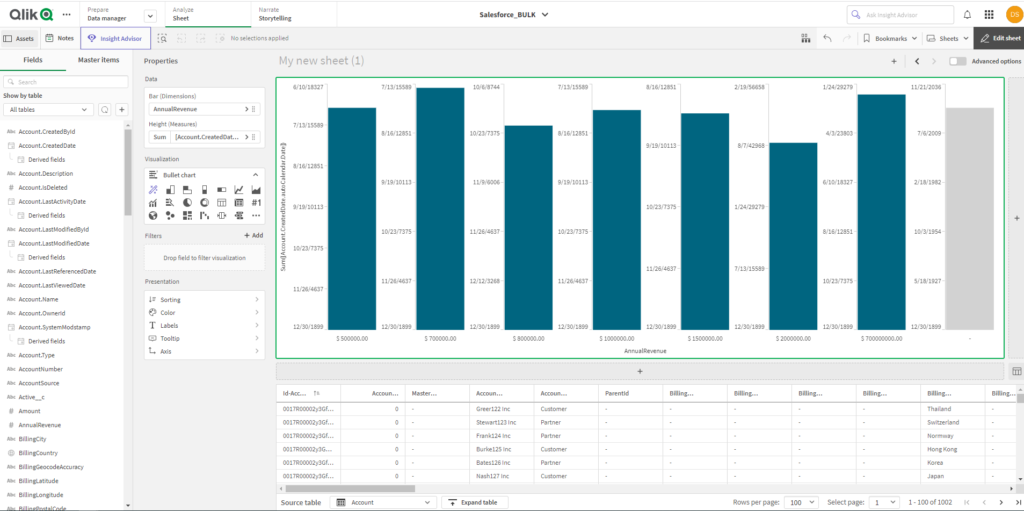
Step 3 – Explore all the features of QlickView while working with Data, all kinds of views, segregations, groupings, and filters.
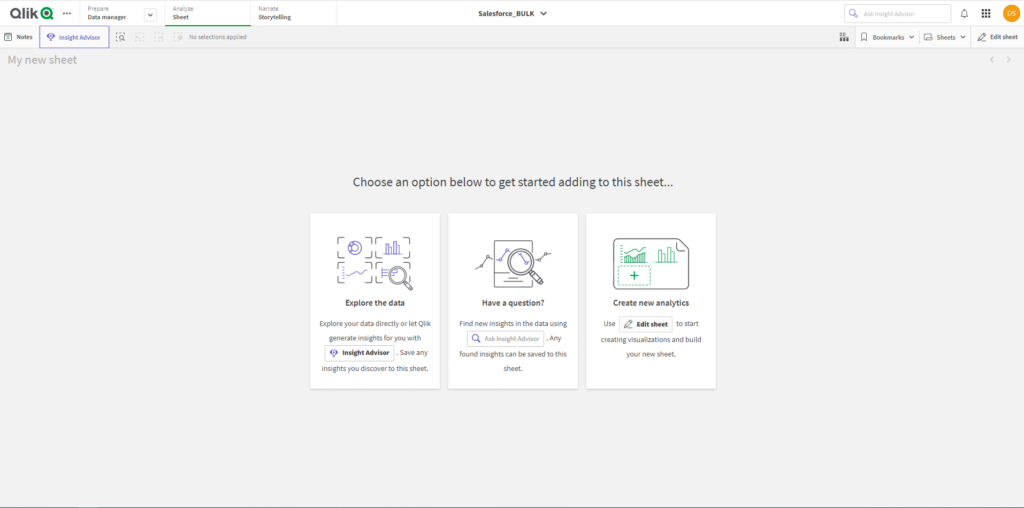
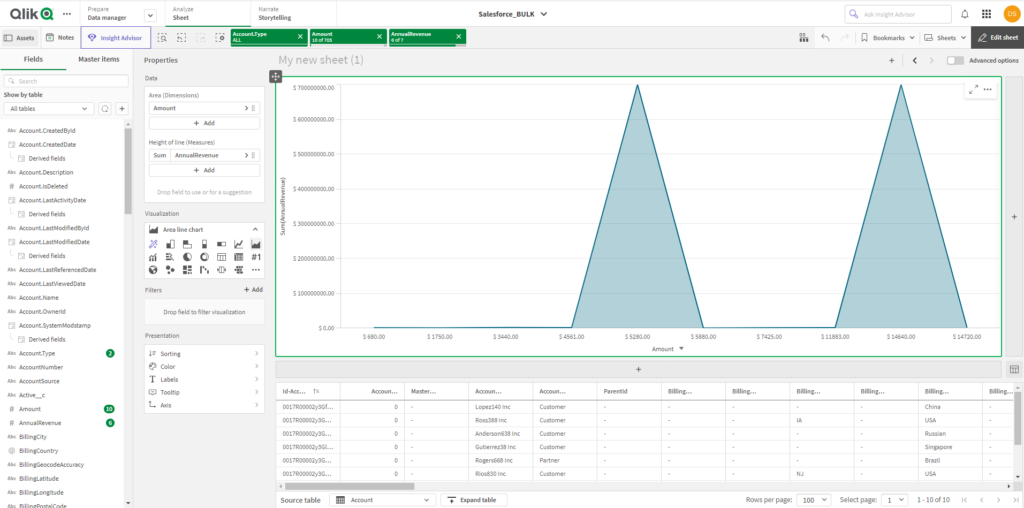
Areas for Improvement in QlikView
While QlikView is a powerful data analysis and visualization tool, there are some areas where improvements could enhance the user experience and functionality:
- Lack of PDF Static Report Creation: Users may find it limiting that QlikView lacks the ability to create static PDF reports and share them via email or other channels.
- Dashboard Resizing: Unlike QlikSense, QlikView dashboards do not automatically resize to fit the device being used, potentially leading to suboptimal user experiences on certain devices.
- Load/Reload Failures: Users have reported occasional issues with data load/reload processes, which may be attributed to poor RAM management or conflicts in multi-user environments.
- Scriptwriting/Coding Complexity: The scripting and coding aspects of QlikView may require expert knowledge, making it challenging for less technical users to create complex visualizations and analyses.
- Cumbersome Embedding/Syncing: Integrating and syncing QlikView with other applications or tools can be cumbersome, potentially hindering seamless data exchange and analysis.
- Outdated UI/UX: Some users may perceive the user interface and user experience of QlikView as outdated when compared to other modern Business Intelligence (BI) tools.
Addressing these areas for improvement could further enhance the usability and effectiveness of QlikView for data-driven decision-making and analytics.
Insight:
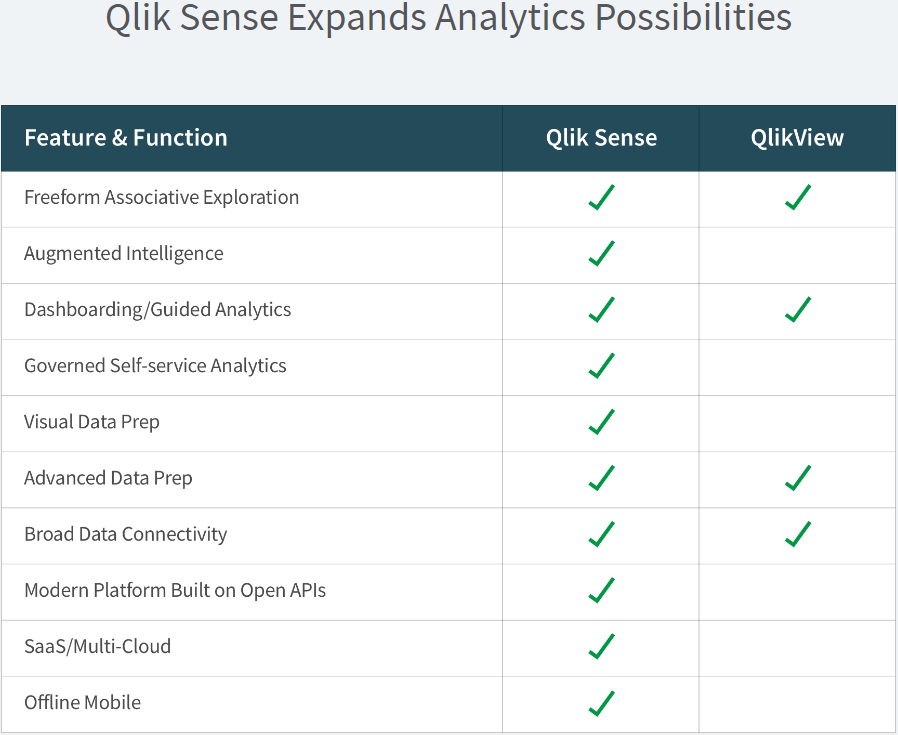
Qlik Sense surpasses QlikView in terms of its analytical power and features.
In Conclusion:
QlikView is a transformative application that enables businesses to leverage data for effective decision-making, seamless collaboration, and superior customer experiences. It’s advanced features and seamless integration with Salesforce empower organizations to achieve data-driven success, ensuring growth and a competitive edge in today’s dynamic business environment. You can always check other alternatives like Conga Grid or Value Analytics.

Dorian is a 4X Certified Salesforce Developer and Administrator with a start in the IT world as a CRM Admin in 2020. Since diving into Salesforce in 2021 via Trailhead and Focus on Force, he has achieved a Ranger Rank, earned several Superbadges, and bagged certifications including the Salesforce Certified Administrator, Platform App Builder, Associate and Platform Developer I by 2023. Dorian is very keen on continuous learning, always looks for fresh ways to improve his knowledge. He enjoys running, boxing, kickboxing and reading diverse kinds of books in his free time.


 Previous Post
 Next Post