
Understanding Salesforce KPIs in CRM
Building a comprehensive Sales KPI Dashboard in Salesforce is crucial for businesses aiming for growth. A Salesforce KPI, specifically designed to track measurable outcomes, oversees and enhances CRM functions that cover vital sales processes. With tools like Salesforce Sales KPI Dashboard, these metrics play a pivotal role in assisting the sales force in effectively allocating resources and prioritizing leads.
Effective use of Salesforce KPIs can lead to significant improvements in sales efficiency. For example, tracking the number of new leads in the pipeline and monitoring the average age of leads helps sales teams prioritize efforts, reducing the likelihood of stalled deals and enhancing overall sales performance.
Measuring Sales Team Efficacy with KPIs
To really dig deep into your sales team’s performance, Salesforce Sales KPI Dashboard is an invaluable tool. Sales KPIs in Salesforce help quantify the effectiveness of a sales team against set benchmarks. They evaluate the team’s overall influence on the organization, diving into metrics like the average number of leads generated every quarter and the rate of deal conversions.
Ensuring Consistency in Sales Goals and Metrics
For cohesive growth, it’s essential that all team members, from individual sales representatives to management, align on their metrics. Rather than having varied focuses, Sales KPI Salesforce tools ensure that there’s a consistent emphasis on the pivotal metrics linked to organizational growth. It’s crucial to highlight that while KPIs serve as a barometer for performance, they shouldn’t be mistaken for sales targets. They are merely indicators measuring activities with significant business implications. Within this framework, sales leaders leverage platforms like Salesforce Funnel KPI Benchmarking to set target KPIs, ensuring these are in line with the desired revenue objectives.
Evolving Nature of Traditional Sales KPIs
Traditionally, sales KPIs, when monitored through systems like the Sales KPI Dashboard in Salesforce, emphasized primary objectives. These included the influx of new leads, the tally of quarterly closed deals, and meeting individual targets. While these metrics still hold immense value, they are sometimes tied to volatile, single transactions. To ensure a company’s growth and consistent revenue stream, it’s fundamental to monitor both these traditional sales KPIs and newer metrics. Tools like the Member KPI Custom Object in Salesforce can help businesses assess the long-term value of customer and employee engagements, ensuring a balanced view of performance and long-term value creation.
Let’s delve deeper into these key sales KPIs:
1. Annual Contract Value (ACV)
- Measures: Yearly average revenue from a customer contract.
- Significance: ACV gives insights into upselling and cross-selling opportunities to maximize revenue. A low ACV might indicate the need for acquiring new revenue-driving customers.
- Calculation: Total yearly contract value / Number of contracts
2. Customer Lifetime Value (CLV)
- Measures: Total revenue from a customer throughout their association with the company.
- Significance: Indicates the effectiveness in fostering loyal and value-driven relationships, leading to predictable revenue.
- Calculation: (Yearly average purchase value) x (Average annual purchases per customer) x (Average customer lifespan)
3. New Leads in Pipeline
- Measures: Fresh leads acquired by each rep in a quarter.
- Significance: Ensuring enough leads in the pipeline to meet sales targets based on conversion rates.
4. Average Age of Leads in Pipeline
- Measures: Duration a lead remains active without conversion.
- Significance: Stagnant leads to waste resources. Prolonged lead durations may call for a pipeline review.
- Calculation: Total age of leads / Number of active leads
5. Conversion Rate
- Measures: Percentage of leads converted to sales by each rep in a quarter.
- Significance: A high rate suggests effective strategies, while a low rate calls for refining tactics.
- Calculation: (Deals closed in a quarter) / (Pipeline leads) x 100
6. Rep Retention
- Measures: Yearly percentage of reps retained since hiring.
- Significance: High retention maintains customer relationships and reduces onboarding costs.
- Calculation: (End-year total reps – New hires) / Start-year total reps x 100
7. Average Rep Ramp Time
- Measures: Duration from a rep’s start to their first outreach.
- Significance: Shorter ramp time shows effective training and onboarding. Lengthy durations suggest the need for process reevaluation.
- Calculation: Total ramp time for all reps / Number of new reps
8. Referrals
- Measures: Quarterly customer referrals per rep.
- Significance: Happy customers acting as advocates accelerate sales cycles.
9. Customer Retention
- Measures: Yearly percentage of returning customers.
- Significance: Retaining customers maximizes ROI and ensures a steady revenue stream. A drop in retention may require revising engagement strategies.
- Calculation: (End-year customers – New customers) / Start-year customers x 100
Insight:
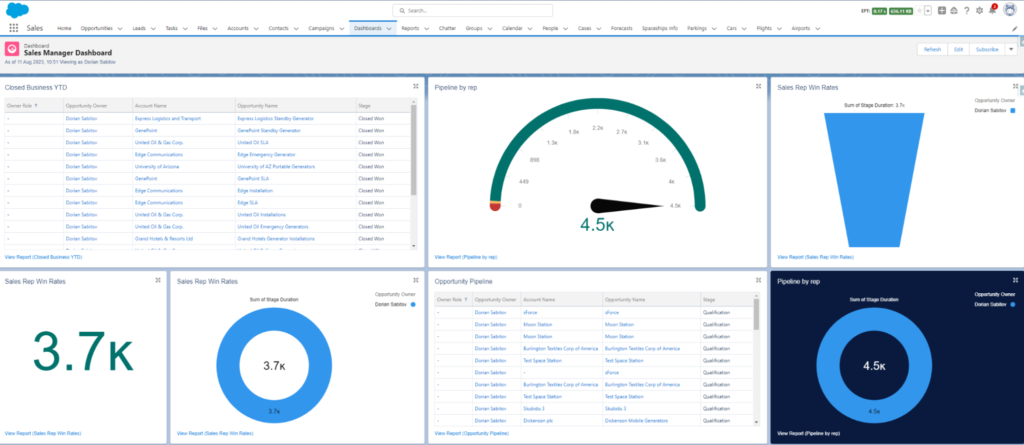
A sales KPI dashboard enables leaders to navigate the vast sea of sales data, pinpointing what truly drives company growth. However, not every dashboard offers the same insights. The most effective ones, integrated with a user-friendly CRM, go beyond mere figures, offering a comprehensive view of sales vitality. This ensures that everyone, from sales representatives to top executives, makes informed decisions to boost revenue. It’s essential to have dashboards that offer broad overviews for senior leadership and detailed, transaction-specific insights for sales reps.
Constructing a Sales KPI dashboard in Salesforce requires careful navigation due to the platform’s intricate nature and adaptability options. Here’s a sequential guide to crafting one.
Understand Your Key Sales KPIs
Before diving into Salesforce, define what KPIs are most important to your organization. Some common sales KPIs include:
- Total Sales
- New Opportunities
- Closed Won Opportunities
- Average Deal Size
- Sales Funnel Conversion Rates
- Sales Cycle Duration
Insight:
You can’t create a new dashboard without related reports. So you need to create report’s first if you don’t have them yet.
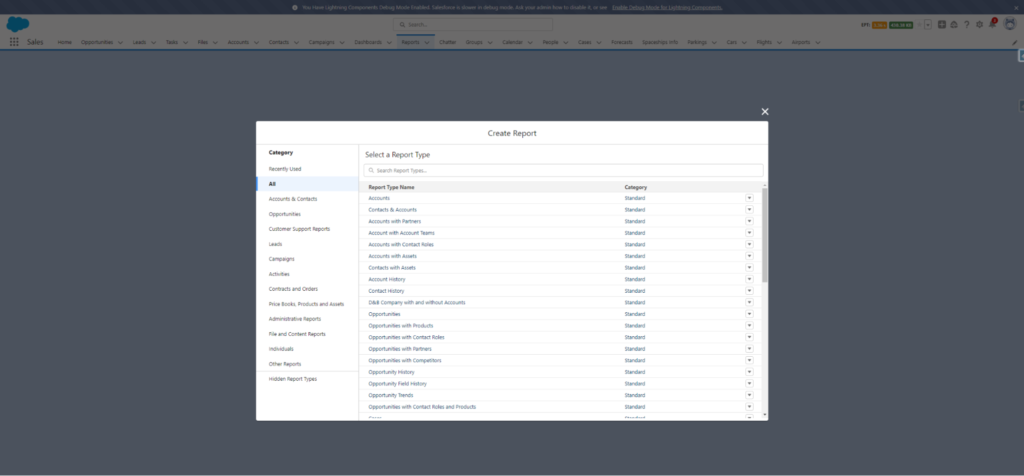
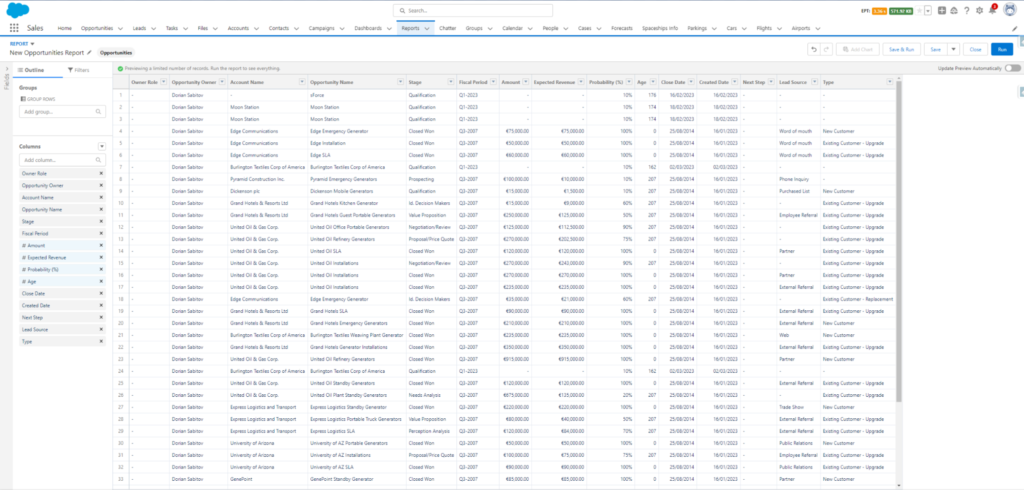
Access Salesforce Dashboard
- Login to your Salesforce account.
- From the App Launcher (grid icon), type and select Dashboards.
Create a New Dashboard
- Click on the New Dashboard button.
- Give your dashboard a name and description.
- Define the folder where you want the dashboard saved, and then click Create.
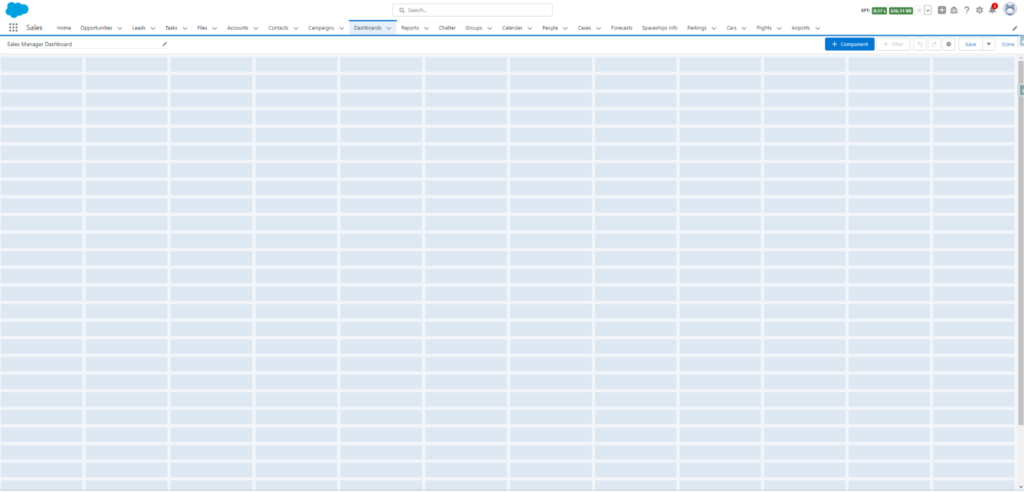
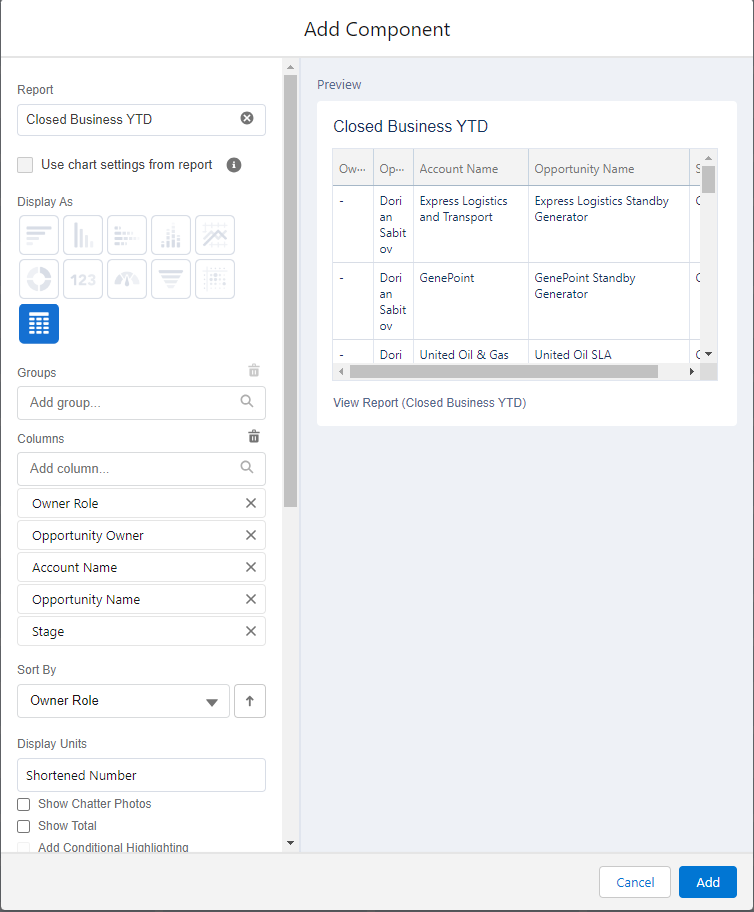
Add Components to Your Dashboard
A component can be a chart, table, metric, or other visual representation of your data.
- Click on the Add Component button.
- You will be prompted to choose a report. Only reports saved in folders you have access to will be available.
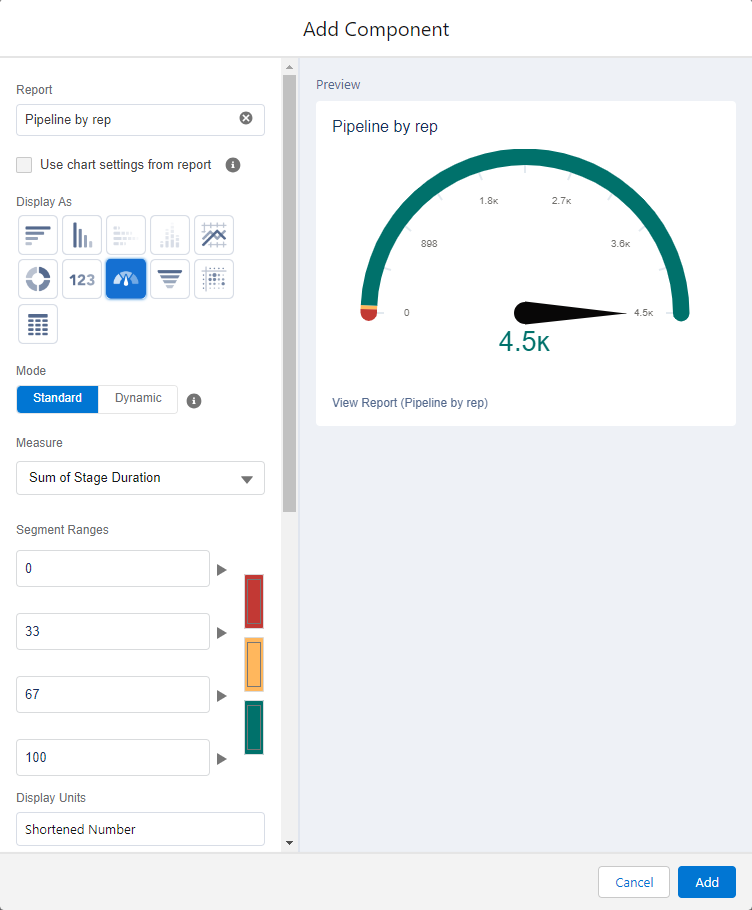
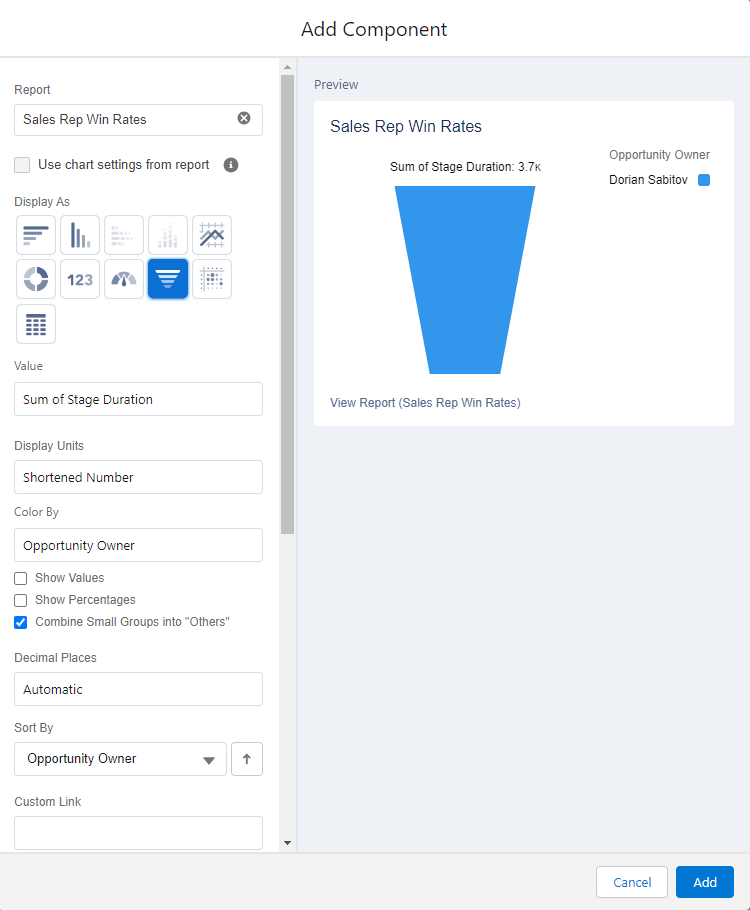
- Once you’ve selected a report, you can then decide on the type of visual (e.g., pie chart, bar chart, donut chart, table, etc.) you want for that component.
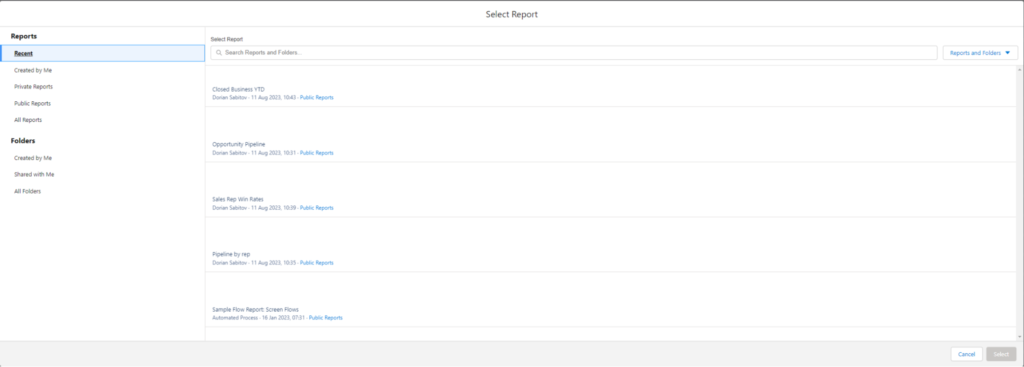
Customize Your Component
- Give your component a title.
- Adjust the display settings, filters, and groupings as desired.
- Use drag-and-drop functionality to adjust the size and position of the component on your dashboard.
Repeat Adding Components
Add as many components as necessary to visually represent all your defined KPIs.
Add Filters (Optional)
If you want to drill down into specific data segments (like a specific time frame, region, or product), you can add filters to the dashboard.
- Click on the Add Filter button.
- Define the filter criteria and the components it should apply to.
Refresh and Save
Regularly refresh your dashboard to get up-to-date data. You can also set up a scheduled refresh if desired.
- Click on the Save button to save any changes you’ve made.
Share the Dashboard
You can share your dashboard with specific users, roles, or groups.
- From the dashboard view, click on the Share button.
- Choose who you want to share the dashboard with and assign viewer or editor permissions as needed.
Regularly Review and Update
As your sales processes and priorities evolve, make sure to revisit and update your dashboard to ensure it remains a relevant and useful tool.
Insight:
The steps above might slightly vary based on your Salesforce edition and any custom configurations your organization might have implemented. Always refer to your Salesforce documentation or admin for specific procedures.
Also you can use Apps from third parties as AppExchange, as an example Salesforce CRM Dashboards.
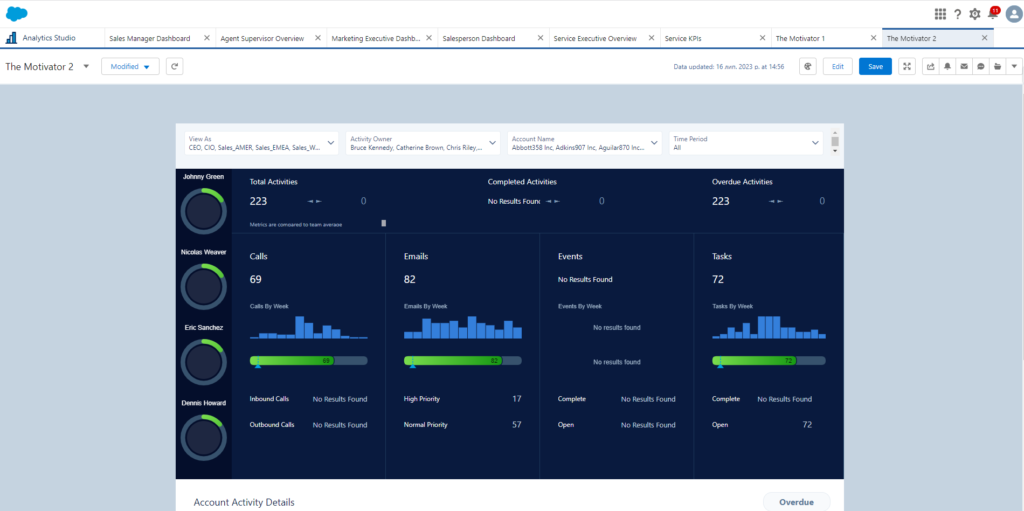
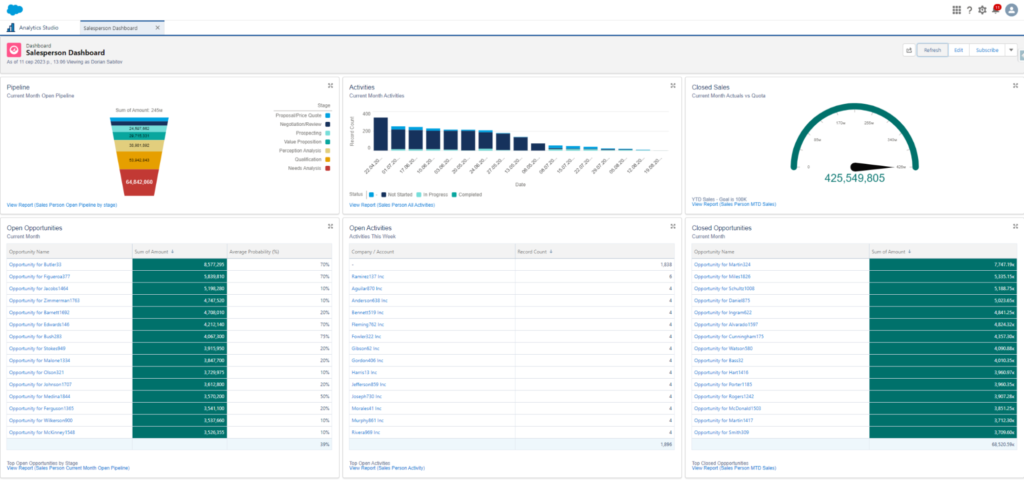
The Salesforce CRM Dashboards offers a suite of preloaded dashboards within the Analytics App. These dynamic dashboards empower your sales and service units to adeptly handle deals and cases, promoting timely and successful business completions. Sales Managers benefit from a clearer view of ongoing opportunities, enriching pipeline forecasts. These initial dashboards and reports lay the groundwork for streamlined reporting in your enterprise.
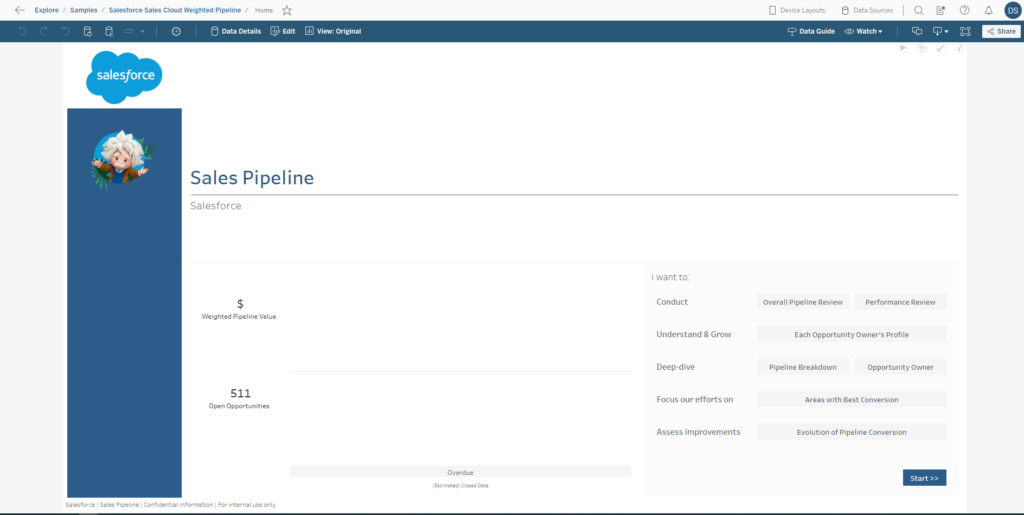
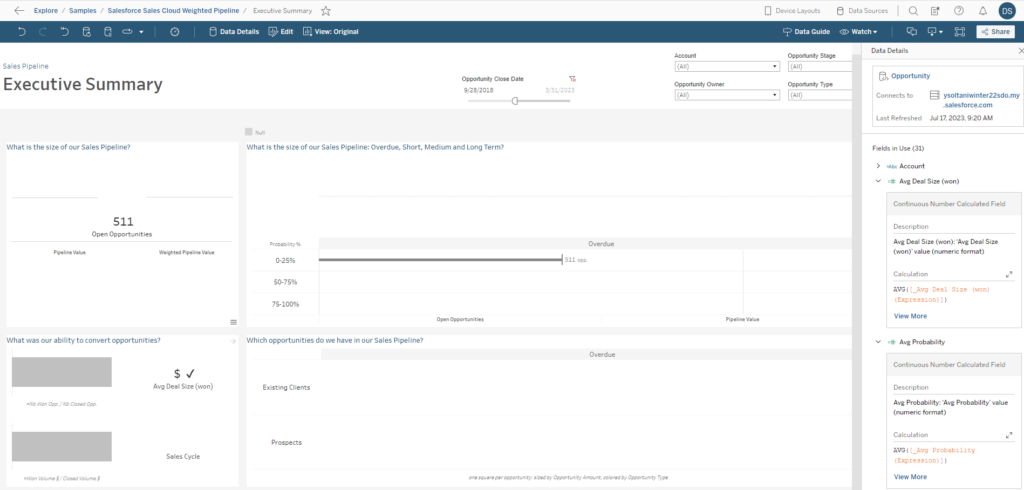
Another nice app that will help you to achieve your goal is Tableau Software Reviews.
Tableau stands as a formidable tool, enabling users to harness actionable insights via real-time visual analytics, promoting limitless data dives. Its dynamic dashboards are avenues for instantly uncovering concealed insights, effortlessly syncing with a plethora of data origins, be it big data, SQL databases, spreadsheets, or prevalent cloud apps.
Through Tableau, intricate data morphs into an analytically-friendly format, illuminating deeper insights. It allows for data portrayal through diverse visual aids like charts, pie diagrams, tables, graphs, plots, and maps, simplifying comprehension and facilitating informed, data-centric decisions.
FAQs on How to Build a Sales KPI Dashboard in Salesforce
What are the Key KPIs for Sales Managers to Include in Their Salesforce Dashboard?
Sales managers should include a variety of KPIs on their Salesforce dashboard to effectively monitor team performance and drive sales strategies. Key KPIs often include:
- Sales Revenue: Tracks the total earnings from sales over a specific period.
- Conversion Rates: Measures the percentage of leads that convert to sales.
- Average Deal Size: Indicates the average revenue per closed deal.
- Sales Cycle Length: Tracks the average time it takes to close a deal from the initial contact.
- Lead Response Time: Measures the speed with which sales reps respond to leads, impacting conversion rates.
- Quota Attainment: Shows the percentage of sales reps meeting or exceeding their sales quotas.
- Customer Acquisition Cost (CAC): Reflects the cost associated with acquiring a new customer. These Sales Manager KPIs dashboards provide a comprehensive view of sales operations, enabling managers to make informed decisions to boost sales performance.
How to Build a Salesforce Sales Pipeline Dashboard for Enhanced Performance Tracking?
Building a Salesforce Sales Pipeline Dashboard involves several steps to ensure it provides valuable insights for performance tracking:
- Select Relevant Reports: Start by identifying reports that represent various stages of your sales pipeline, such as lead generation, qualification, proposal, negotiation, and closing.
- Create and Configure Dashboard Components: Add components like funnel charts for pipeline stages, bar charts for sales by product or region, and leaderboards for top performers. Configure each component to display current data and historical trends.
- Set Goals and Benchmarks: Include components that compare current performance against targets and past performance to track progress and identify areas for improvement.
- Implement Filters: Allow users to filter data by different dimensions such as time periods, sales teams, or geographic regions to analyze specific aspects of the sales pipeline.
- Make it Interactive: Use dynamic components that update in real time and allow users to drill down into specific data points for detailed analysis. This type of dashboard provides a real-time overview of the entire sales pipeline, helping managers monitor performance and make strategic adjustments.
What Components Should a Salesforce Sales Manager Dashboard Include for Comprehensive Insights?
A Salesforce Sales Manager Dashboard should include various components to offer a complete view of sales activities and team performance:
- Opportunity Insights: Displays ongoing deals with details on stage, value, and expected close dates.
- Team Performance Metrics: Includes metrics like individual and team sales figures, quota attainment, and rankings.
- Activity Tracking: Monitors sales activities such as calls made, emails sent, and meetings held.
- Forecast Accuracy: Compares sales forecasts against actual sales to gauge forecasting effectiveness.
- Customer Satisfaction Metrics: Tracks customer feedback and satisfaction scores to assess service quality.
- Revenue and Margin Analysis: Analyzes revenue growth and profit margins over time. These components help sales managers grasp both the micro and macro aspects of their operations, facilitating effective management and strategic planning.
How to Customize a Sales REP dashboard Salesforce for Individual Performance Monitoring?
Customizing a Salesforce dashboard for individual sales representatives involves focusing on metrics that reflect personal performance and areas for improvement:
- Personal Sales Performance: Show individual sales figures against targets and historical performance.
- Lead Conversion Rates: Track how effectively the rep converts leads into customers.
- Deal Size and Quality: Analyze the average deal size and the quality of deals closed.
- Activity Metrics: Display metrics related to sales activities such as call logs, appointment settings, and follow-ups.
- Training and Development Needs: Incorporate feedback from performance reviews to suggest areas for skills improvement.
- Personalized Alerts and Notifications: Set up alerts for upcoming tasks, lead follow-ups, and milestones to keep the rep organized. This dashboard should be highly personalized, providing the sales rep with actionable insights into their performance and direct feedback on areas where they can improve.
In Conclusion:
Utilizing dashboards that visualize Sales KPIs in Salesforce equips companies with a holistic view of their sales dynamics. These visual representations encapsulate both short-term achievements and long-term relationship values, offering clarity on performance and areas for improvement. As businesses navigate an ever-changing market, the ability to instantly access, interpret, and act on these insights becomes invaluable. Dashboards not only streamline decision-making processes but also empower teams to allocate resources effectively, prioritize leads, and manage customer and employee relationships strategically. By integrating these visual tools, organizations stand poised to harness the full potential of their sales strategies, ensuring alignment with their broader objectives and driving sustained growth and profitability.

Dorian is a 6X Certified Salesforce Developer and Administrator with a start in the IT world as a CRM Admin in 2020. Since diving into Salesforce in 2021 via Trailhead and Focus on Force, he has achieved a Ranger Rank, earned several Superbadges, and bagged certifications including the Salesforce Certified Administrator, Platform App Builder, Associate and Platform Developer I by 2023. In 2024 he also became Salesforce Certified AI Associate and earned Certified AI Specialist Certification in 2025. Dorian is very keen on continuous learning, always looks for fresh ways to improve his knowledge. He enjoys running, boxing, kickboxing and reading diverse kinds of books in his free time.


 Previous Post
 Next Post
One Response to “How to Build a Sales KPI Dashboard in Salesforce”