QlikView and Tableau are instrumental in assisting business leaders and decision-makers in formulating strategies based on data. The features offered by these Business Intelligence (BI) tools, such as automated data gathering, analysis, and visualization, can result in significant time and energy savings.
While both BI solutions offer cloud services and enable users to construct guided applications and dashboards from virtually any source, their methodologies and effectiveness vary. Familiarize yourself with the primary characteristics of Qlik and Tableau Salesforce to make an informed decision about the best fit for your specific business scenario and objectives. Familiarize yourself with the primary characteristics of Qlik and Apps like Tableau to make an informed decision about the best fit for your specific business scenario and objectives.
QlikView: Key Features
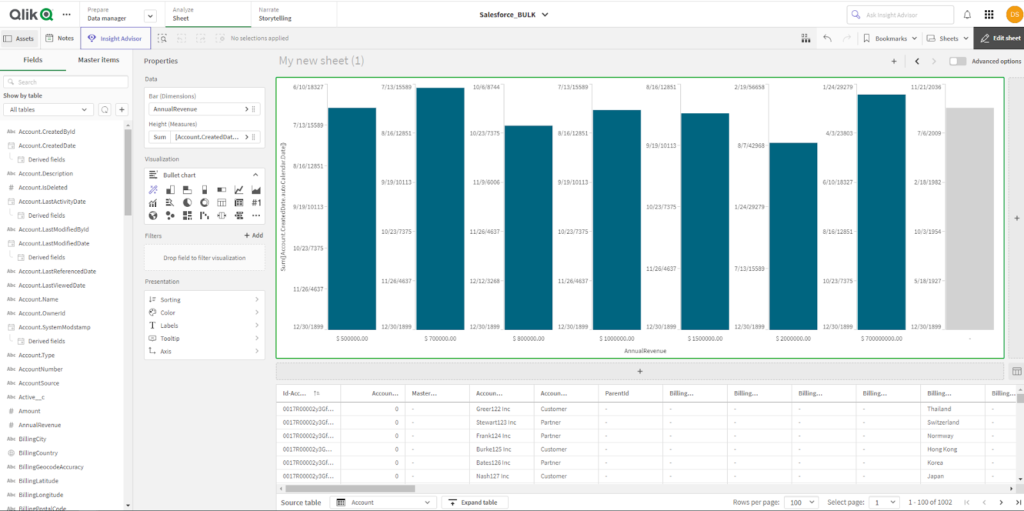
QlikView stands out primarily for its ability to generate intelligent visualizations and mappings, while also offering analytical capabilities through the Qlik Analytics Engine. This feature harnesses Qlik’s unique associative technology and AI to consolidate data from a multitude of sources.
This BI suite offers advanced configurations geared towards power users, such as allowing scripts to be used as inputs for making predictions. At the same time, it accommodates beginners through a user-friendly drag-and-drop interface that simplifies application creation.
QlikView prioritizes context-based insights and security in its features.
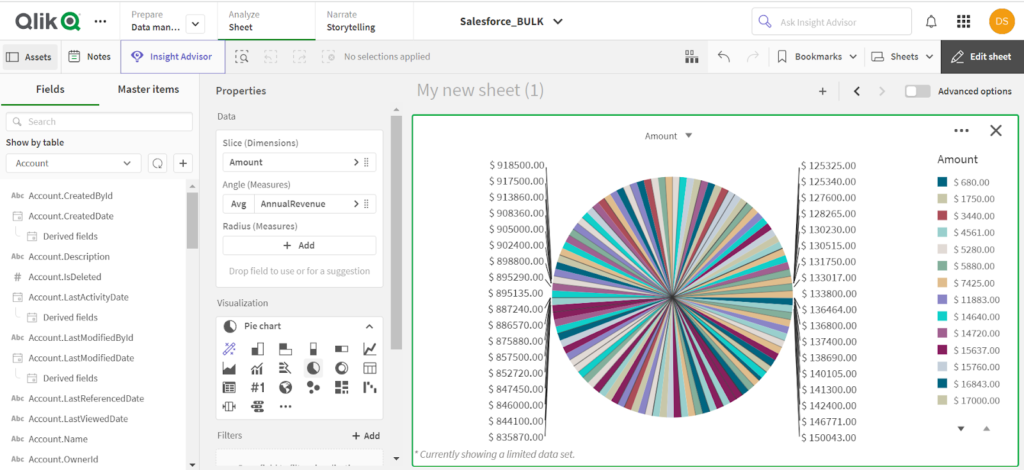
Tableau: Key Features
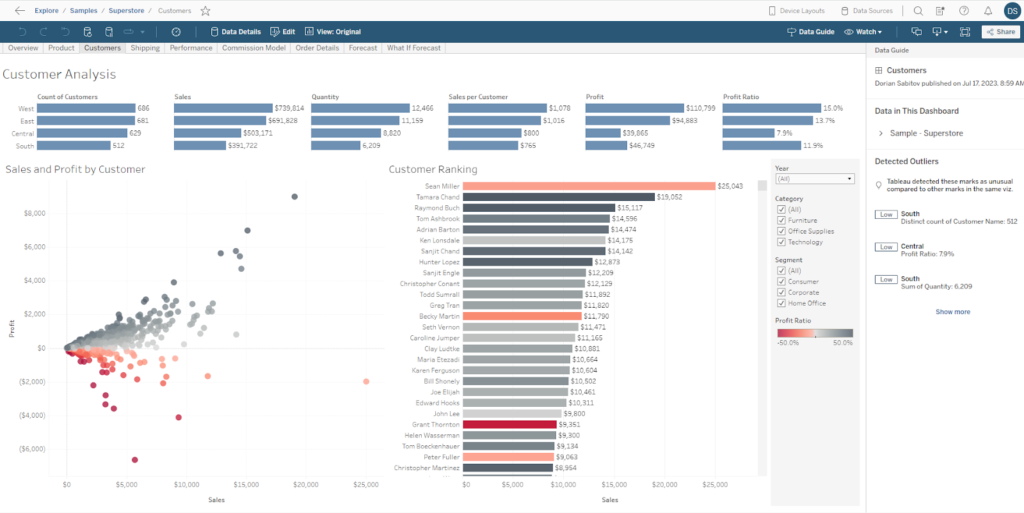
Tableau is abundant with features and offers dynamic visualizations. It has the capability to draw data from various sources, be it bespoke databases, cloud services, or Google Analytics, and seamlessly integrates this data natively. There’s no need for complex macros or advanced scripting to get started.
Tableau’s prowess extends to a wide range of analysis types, including statistical, behavioral, multidimensional, and predictive. The Einstein Discovery tool utilizes Salesforce’s no-code platform and machine learning to forecast emerging trends and provide recommendations.
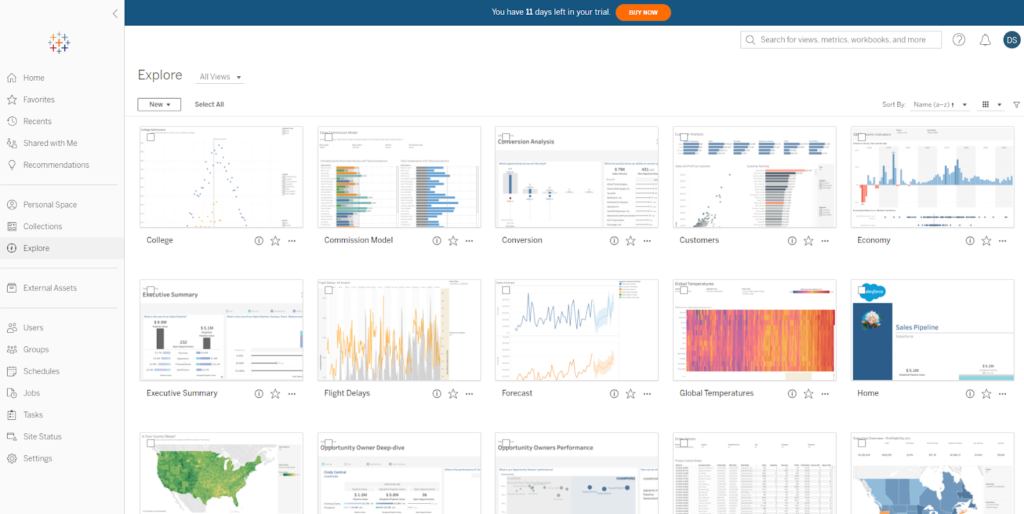
With an emphasis on user-friendly operation, Tableau does not demand any prior selection. It accommodates users with diverse skill levels, though power users have the option to apply further filters and optimizations. For developers, robust APIs are available for integrating the software into existing applications or websites.
QlikView versus Tableau: Contrast and Comparison
| Basis Of Difference | Tableau | QlikView |
| Overview: | Emphasizes heavily on visual analytics, is user-friendly for beginners, and utilizes a wide array of graphical elements including TreeMaps, Overlaps, and more. | A dashboard application that provides a multitude of functionalities, along with extensive reporting features at the enterprise level. |
| Rating: | ⭐⭐⭐⭐⭐ 5 Average | ⭐⭐⭐⭐ 3.5 Average |
| Ease of Use: | The interface is straightforward and uncluttered, facilitating the easy creation of views and ensuring an efficient user experience. | This tool is user-friendly and excels at uncovering hidden trends. Simply input any word in any sequence into the search box for immediate and associative outcomes, and it will display correlations and links across your data. However, users may need help to create their own views due to the menu-driven properties. |
| The Simplicity of Learning: | The community is vibrantly involved and there is an abundance of resources at your disposal, all designed to optimize your learning journey with this software. | This software boasts a dynamic community and offers a wealth of resources, all designed to optimize your learning experience. |
| Cost: | Tableau offers three editions. The Viewer is strictly for viewing, the Explorer permits data manipulation, and at least one Creator seat, priced at $70, is necessary for every license. | Qlik presents three packages: the Business option which starts at $30 per user, per month, the Enterprise Client-Managed, and the Enterprise SaaS. For clients seeking high-scale efficiency, might opt for either the SaaS model or the client-managed alternative, both of which provide a top-tier solution for expanding analytics across departments and entire organizations. Moreover, a variety of additional pricing levels are offered to accommodate various data integration requirements. |
| System Architecture: | The architecture of Tableau predominantly focuses on three key phases: Data Integration, Analysis, and Visualization. | The architecture of QlikView primarily revolves around three components: the User Interface, the Backend System, and the Resources. |
| Deployment: | Tableau offers a range of solutions tailored to specific needs: Tableau Desktop for individual users, Tableau Online for cloud-based applications, and Tableau Server for on-site implementations. You have the flexibility to select from a desktop, on-premises, or cloud-based solution. | Qlik provides a variety of options tailored to individual and enterprise needs with QlikView and QlikSense. QlikSense is also available for cloud-based and business editions. You have the option to select from SaaS-based solutions, on-premises, or cloud-based deployments. |
| Speed: | Efficient and rapid sharing of reports, both online and offline. | Enhanced speed in analysis, outcome delivery, and decision-making processes. |
| Visualization: | The tool facilitates the automatic generation of dashboards via visualization templates, and it offers pre-designed dashboard starters and templates. It also comes with ready-to-use animations and other features straight out of the box. This tool excels in geo-spatial visualizations, offering a multitude of options for data representation. It consistently delivers visualizations of the highest quality. | This tool offers an array of options for information visualization, boasting a variety of objects to work with. These object properties can be easily manipulated for customization, enabling the creation of custom charts such as waterfall, boxplot, and geospatial charts. The object insertion process also includes layout and formatting options that align with the document’s theme. To enhance its visual appeal, some attention to formatting options is required. |
| Query: | The Ask Data feature facilitates natural language querying, expedites report generation, and has built-in versioning capabilities. | QlikView offers supplementary modules and direct access to reports from the Qlik Sense Hub. |
| Mobility: | Tableau is universally compatible and accessible over the internet. Whether on a laptop, tablet, or phone, Tableau is always at your fingertips. | QlikView is device-independent, allowing convenient access from any location. This leads to a significant acceleration in decision-making compared to conventional methods. |
| Security: | Tableau boasts robust security features, largely managed by the Tableau Server. As a modern enterprise analytics platform, it facilitates self-service analytics at scale, underpinned by rigorous governance. Security forms the cornerstone of any data and content governance strategy, and Tableau Server offers comprehensive features and deep integration to address every facet of enterprise security. By advocating for the use of trusted data sources across all users, Tableau enables organizations to utilize the correct data for swift and accurate decision-making. | QlikView is outfitted with an array of security measures, including Script Security, Document Security, Section Access, and User Authentication. Direct interactions with the QlikView Document via QlikView Desktop strictly follow Windows NTFS File Security. Additionally, entry to the web-oriented QlikView Enterprise Management Console is confined to Windows Users who are part of a specific local Windows Group. |
| Scalability: | You might have come across claims stating that Tableau offers superior scalability than QlikView, or vice versa, that QlikView can scale more rapidly than Tableau. The reality, however, is that both platforms are capable of managing massive amounts of data. Most organizations do not generate a volume of data that would exceed the processing capabilities of either solution. | |
| Customization: | This tool offers significant flexibility in customizing charts and graphs, requiring only a fundamental level of programming knowledge. It simplifies the process of data storytelling considerably. | Customization can be challenging as it requires an understanding of specific technical elements. The flexibility in terms of chart and graph creation could be improved. |
| Mobile App: | It facilitates search and browsing capabilities through dashboards. However, access to the mobile app necessitates a Tableau Server. | It seamlessly integrates with the Enterprise Server, providing visualization and administrative capabilities on mobile devices. |
Selecting Your BI Tool
Both Tableau and QlikView hold solid reviews on Gartner with identical overall ratings of 4.3/5.
Both utilize machine learning to discern trends and construct robust models, yet Tableau demands less technical proficiency and is acclaimed as an industry benchmark.
Both accommodate a broad spectrum of devices, operating systems, and both web and mobile platforms. Data and reports can be accessed virtually from any device. Each of the two companies has fostered robust communities and offers excellent support.
Both tools provide a commendable degree of security. Their services are predicated on trusted data sources and other key components of enterprise security. However, QlikView exhibits superior access control capabilities.
Top 5 FAQs about Tableau vs QlikView
What are the key differences between Tableau and QlikView?
Tableau is known for its intuitive drag-and-drop interface, making it user-friendly for data visualization, while QlikView offers a more complex, developer-centric environment with powerful data integration and manipulation capabilities. Tableau focuses heavily on ease of use, whereas QlikView emphasizes flexibility in creating custom analytics solutions.
Which tool is better for data visualization: Tableau or QlikView?
Tableau excels in data visualization with its easy-to-use interface and wide range of visual options. It’s particularly strong in creating dashboards quickly. QlikView, while capable, requires more setup and technical expertise to achieve similar visual outputs, but offers more customization options.
Can both Tableau and QlikView handle large data sets effectively?
Yes, both Tableau and QlikView are capable of handling large data sets. Tableau offers features like data extracts to optimize performance, while QlikView uses an in-memory processing model to enable fast querying of large volumes of data.
Which platform is more suitable for a non-technical user: Tableau or QlikView?
Tableau is generally more suited for non-technical users due to its intuitive interface and straightforward setup. QlikView is more complex and often requires deeper technical knowledge to fully utilize its capabilities.
What industries benefit most from Tableau and QlikView?
Tableau is widely used in industries like marketing, sales, finance, and healthcare due to its focus on visualization and ease of use. QlikView is popular in industries such as manufacturing, logistics, and supply chain management, where more customized and complex analytics are required.
Conclusion:
The contest between Tableau and QlikView doesn’t result in a definitive winner. Here’s why. Each tool excels in its unique way, making the choice heavily dependent on the specific needs and requirements of the organization (the users). The most suitable tool can only be determined by aligning the tool’s features with the organization’s needs.
If your objective encompasses data discovery, app development, and data visualization, QlikView may be the ideal tool for you. Conversely, if you’re seeking a user-friendly data quality analysis dashboards Salesforce featuring eye-catching graphics, an intuitive user interface, and drag-and-drop functionality, then Tableau might be your go-to option. For larger organizations requiring comprehensive software with advanced capabilities to manage extensive data sets, QlikView would be suitable. On the other hand, Tableau is a perfect choice if you require a straightforward drag-and-drop visualization tool that offers exceptional scalability.

Dorian is a 6X Certified Salesforce Developer and Administrator with a start in the IT world as a CRM Admin in 2020. Since diving into Salesforce in 2021 via Trailhead and Focus on Force, he has achieved a Ranger Rank, earned several Superbadges, and bagged certifications including the Salesforce Certified Administrator, Platform App Builder, Associate and Platform Developer I by 2023. In 2024 he also became Salesforce Certified AI Associate and earned Certified AI Specialist Certification in 2025. Dorian is very keen on continuous learning, always looks for fresh ways to improve his knowledge. He enjoys running, boxing, kickboxing and reading diverse kinds of books in his free time.


 Previous Post
 Next Post
as mentioned in the article, Machine Learning (ML) capabilities enhance both QlikView and Tableau, but they serve users differently. QlikView is best for those with data science knowledge, allowing for the integration of external ML models to provide predictive analytics. It’s ideal for complex analytical needs.
Tableau simplifies ML with Einstein Discovery, making predictive insights accessible to users of all skill levels directly within its dashboards. It’s user-friendly and doesn’t require programming skills.
Main Differences are:
Ease of use – Tableau is more straightforward, catering to users without technical expertise. QlikView caters to users comfortable with data science.
External integration – QlikView stands out for its ability to integrate external ML models, suitable for organizations with custom ML solutions.
Predictive insights – both offer predictive analytics, but Tableau focuses on easy-to-understand recommendations, making it easier for decision-making.
In summary, Tableau is the choice for easy access to ML insights, while QlikView suits those looking for deep, customizable analytics.
Regards,
Dorian Sabitov