


Sometimes AppExchange gives you many options, but not always an easy answer. For a Salesforce buyer, the real challenge is not only how many apps exist, but how much useful signal sits behind those listings.
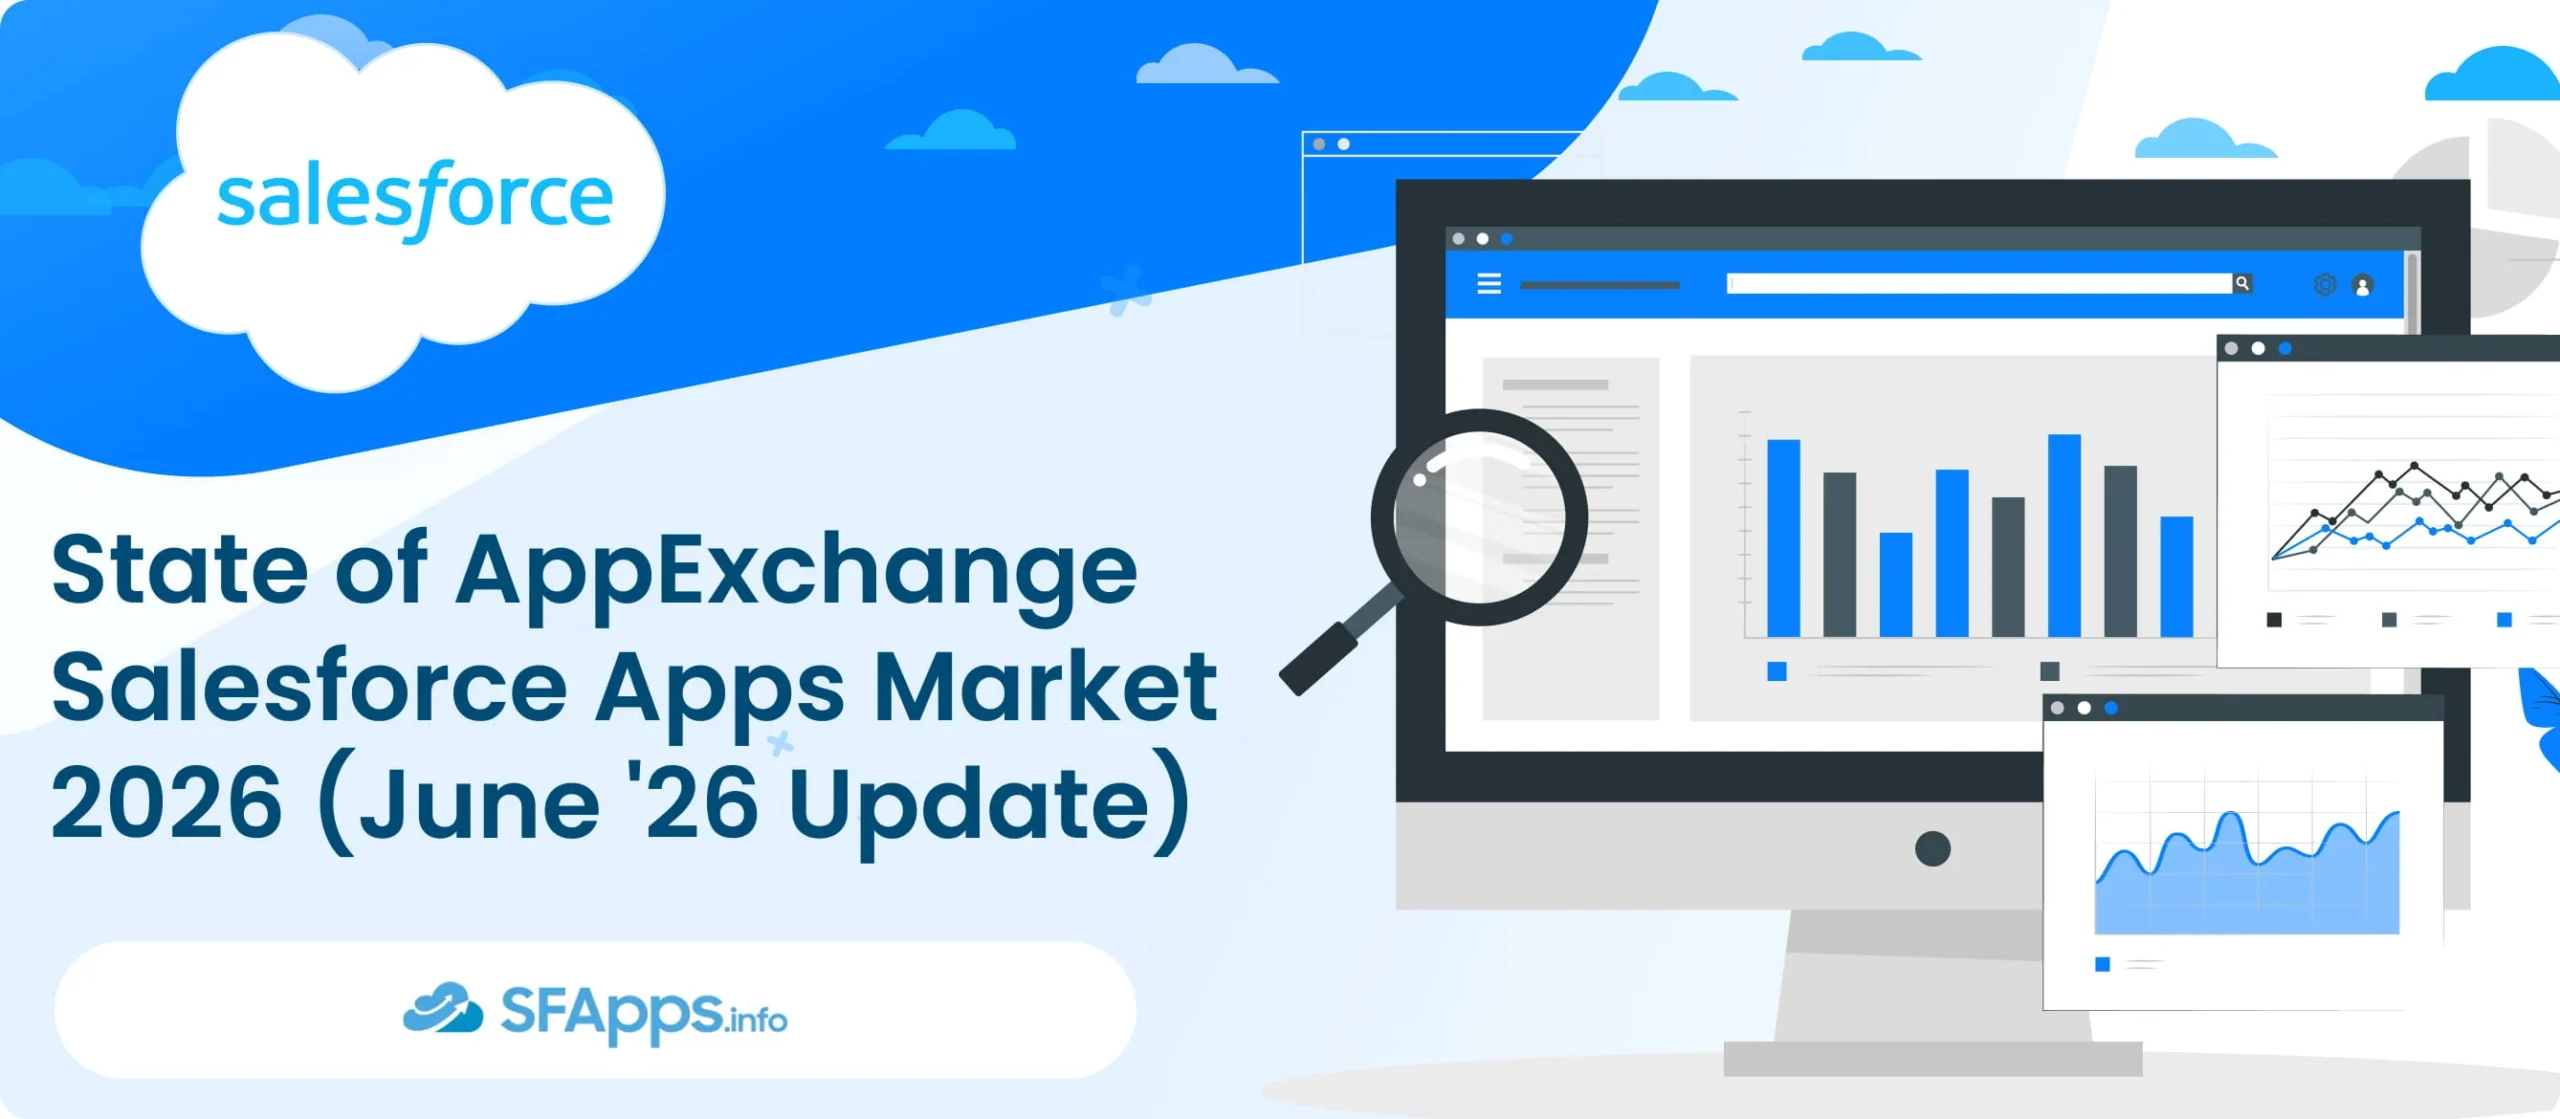
This research gives a fresh look at the public Salesforce app market as it appeared in June 2026.
We collected publicly visible app listings from AppExchange on June 3, 2026. Then we reviewed the apps by category, industry, Salesforce product, developer, reviews, and ratings.
The dataset covers only publicly listed applications available at the time of collection. Private listings are not included. Apps that were removed, hidden, or no longer publicly available are also outside this snapshot.
- Salesforce AppExchange Marketplace Overview: Why June 2026 Looks Different
- Oldest Apps Still Visible on AppExchange in 2026
- Salesforce AppExchange Apps by Business Need: A Market That Moves Unevenly
- AppExchange Market Analysis by Industry: Where Vendors Want to Be Found
- Salesforce Product Coverage in the Salesforce App Marketplace
- Salesforce App Ecosystem: Fewer Developers, but Multi-App Publishers Stay Strong
- AppExchange App Analytics: Reviews, Ratings, and the Apps Buyers Already Know
- AppExchange Stats June 2026: Key Numbers From the Market Snapshot
- Closing Thought: The Market Needs Context, Not Only a Bigger Number
Salesforce AppExchange Marketplace Overview: Why June 2026 Looks Different
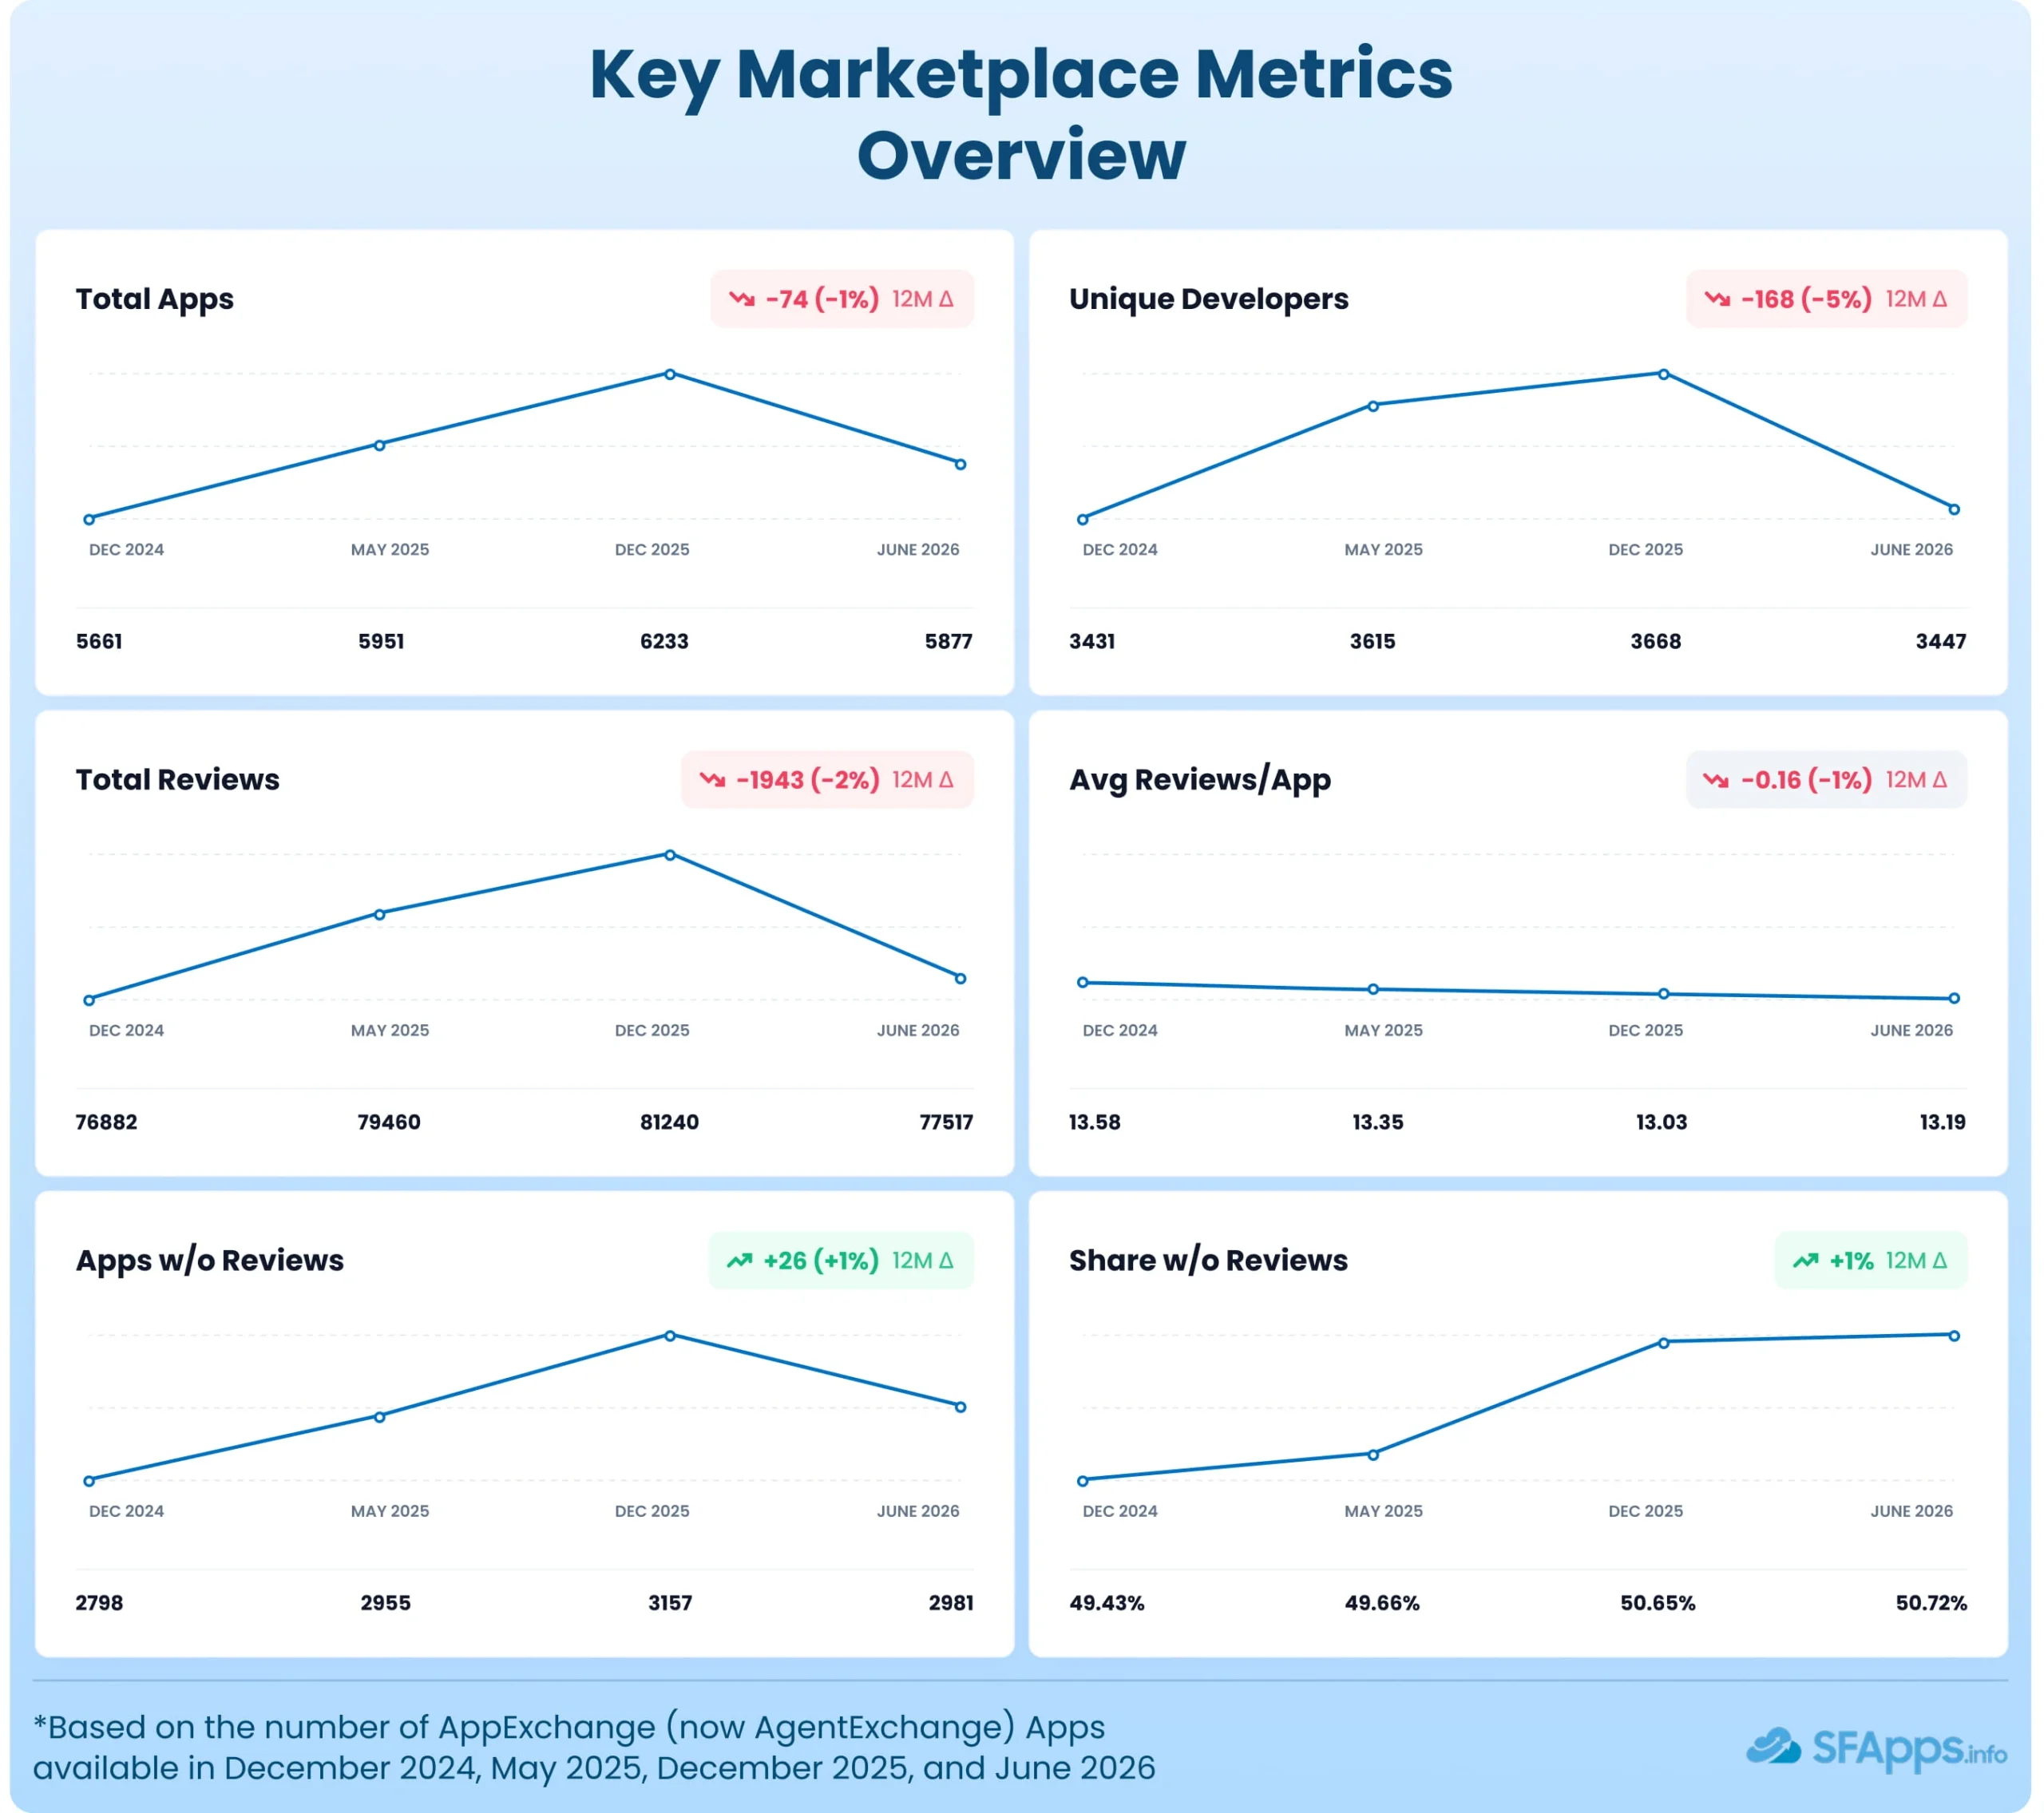
The following charts already shows that this update is not a simple growth story. In the latest AppExchange market research, the public AppExchange app count kept moving up. In June 2026, the direction changed.
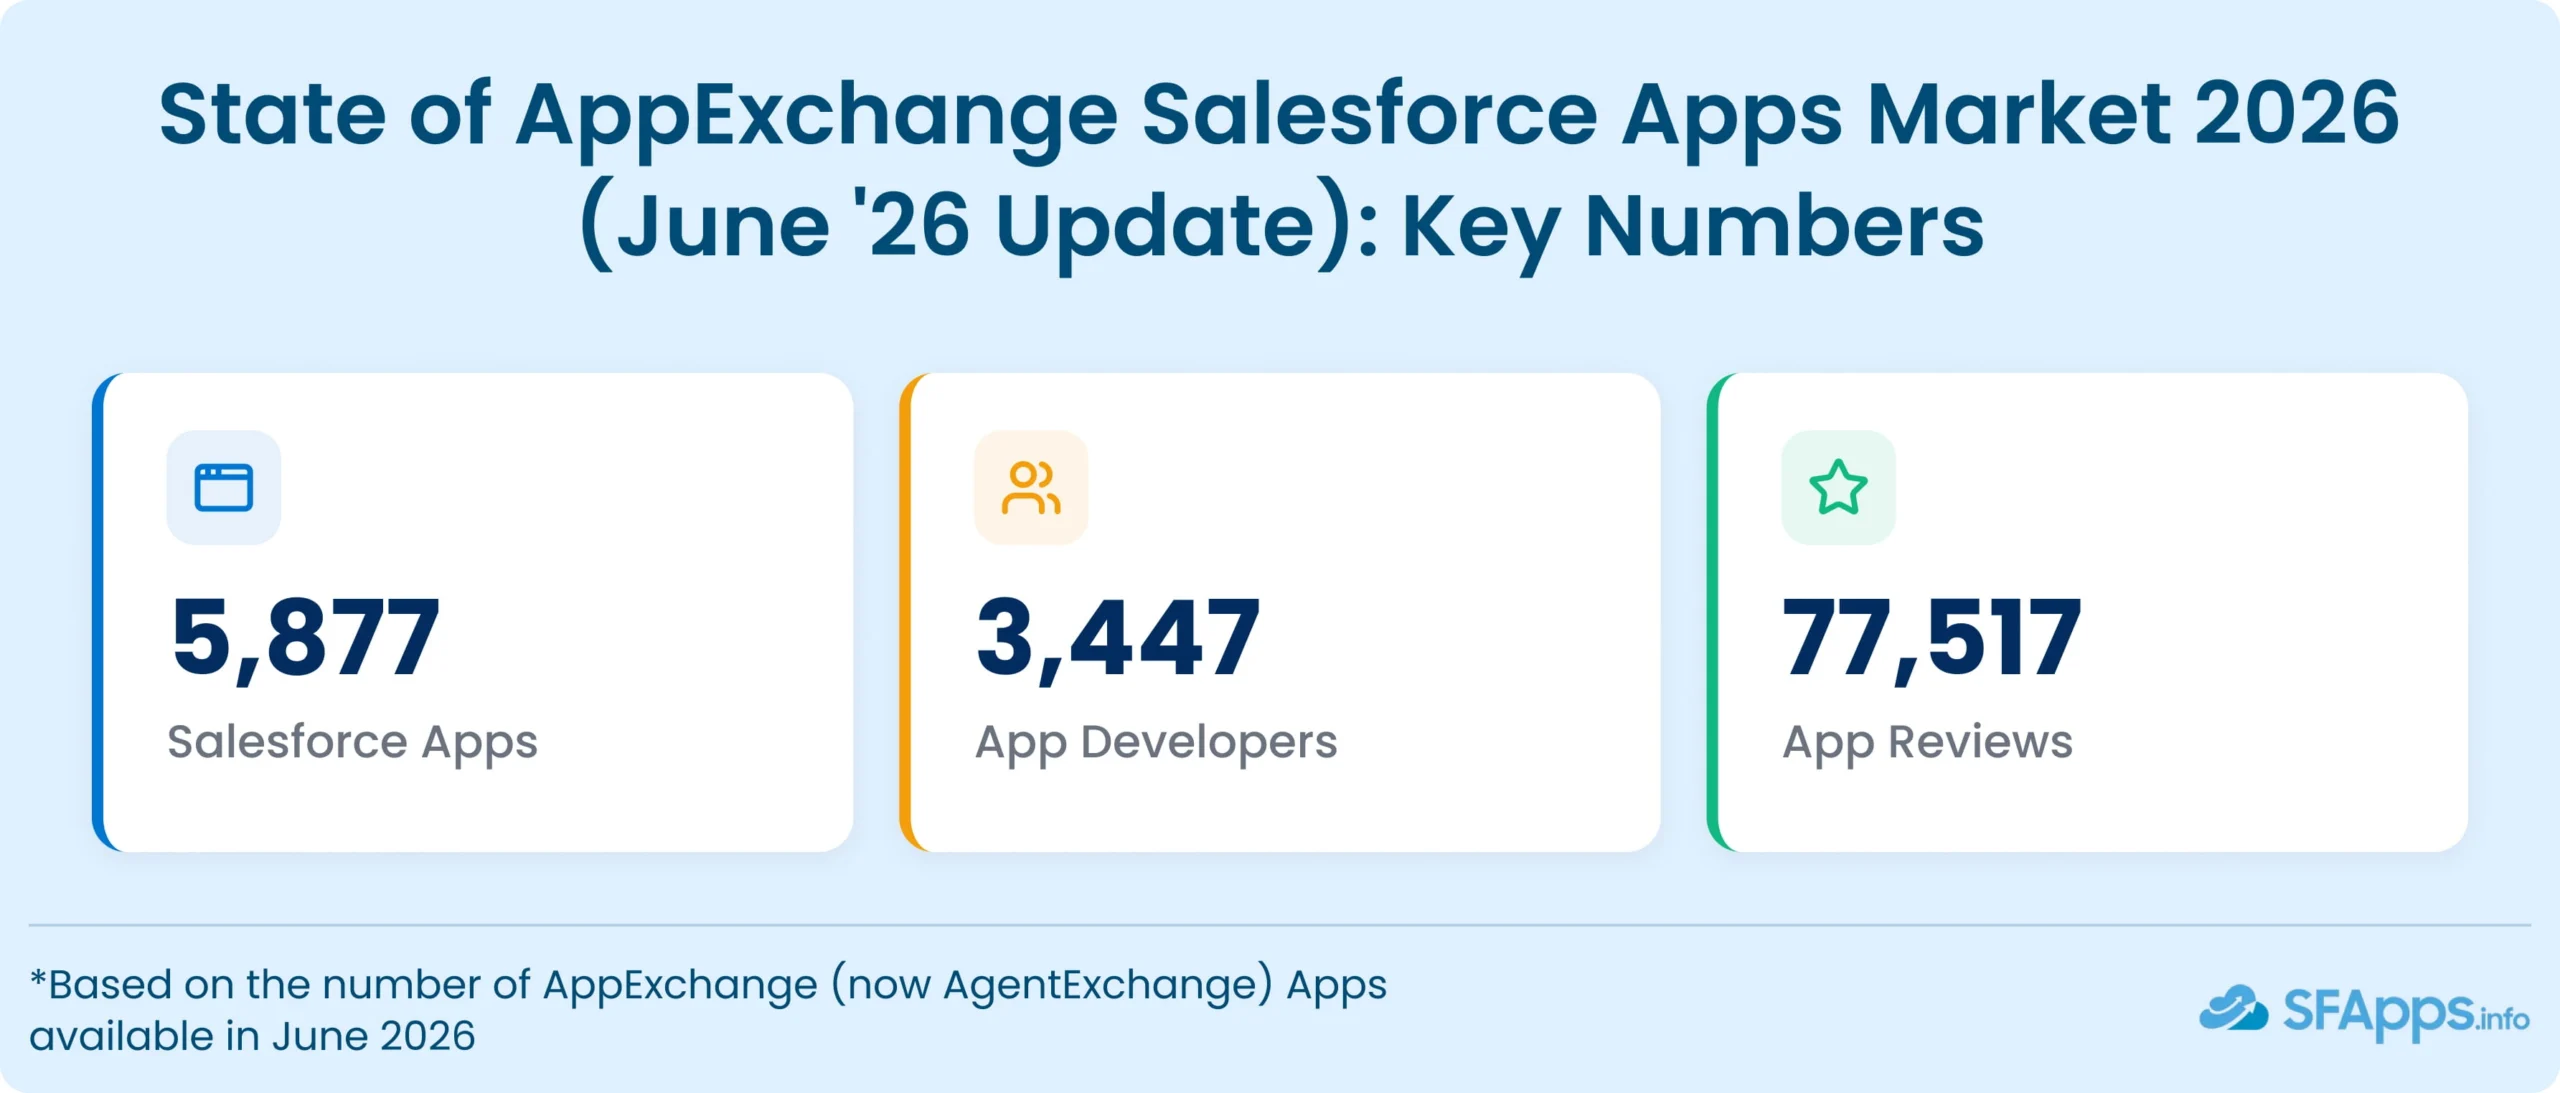
For readers looking for the Salesforce AppExchange number of apps 2026, this snapshot gives a clear public count: 5,877 apps. One year earlier, in May 2025, the dataset had 5,951 apps.
So the visible marketplace is smaller by 74 apps, or 1%. Compared with December 2025, the change is more noticeable because that snapshot had 6,233 apps.
This does not mean that Salesforce customers suddenly have fewer useful choices in every area. Some listings from the December 2025 dataset were no longer public in June 2026. They may have been removed, hidden, moved to private listings, or changed in a way that made them unavailable in the public export. That is why this June update should be read as both an AppExchange market analysis and a visibility check.
The same pattern appears in developer and review data. The number of unique developers decreased from 3,615 in May 2025 to 3,447 in June 2026. Total reviews also went down, from 79,460 to 77,517. At the same time, the average number of reviews per app stayed at 13.
For buyers, the review gap is still one of the most important signals. In June 2026, 2,981 apps had no reviews, compared with 2,955 in May 2025. The share of apps without reviews also increased slightly, from 49.66% to 50.72%.
To see how this picture started forming, the AppExchange market report 2024 gives useful earlier context.
Another noticeable change is the move toward AgentExchange. Salesforce now presents AgentExchange as one marketplace that brings together AppExchange, Slack Marketplace, and the Agentforce ecosystem. Our dataset focuses on public Salesforce app listings, not the full AgentExchange catalog across Salesforce and Slack. For the wider marketplace view, the AgentExchange marketplace analysis gives more context.
After the basic question of how many apps on Salesforce AppExchange are visible, the next question is what changed behind that number. Let’s follow the data step by step, see what changed in the world’s largest marketplace for enterprise cloud applications, and look at what it means for buyers, admins, and app vendors.
Oldest Apps Still Visible on AppExchange in 2026
AppExchange started in 2006, so this June update also gives us a view across 20 years of public app listings. Looking at the number of apps in Salesforce AppExchange by listing age adds another useful layer to the market view.
For comparison with the earlier 2026 snapshot, you can read full analysis of the previous dataset.
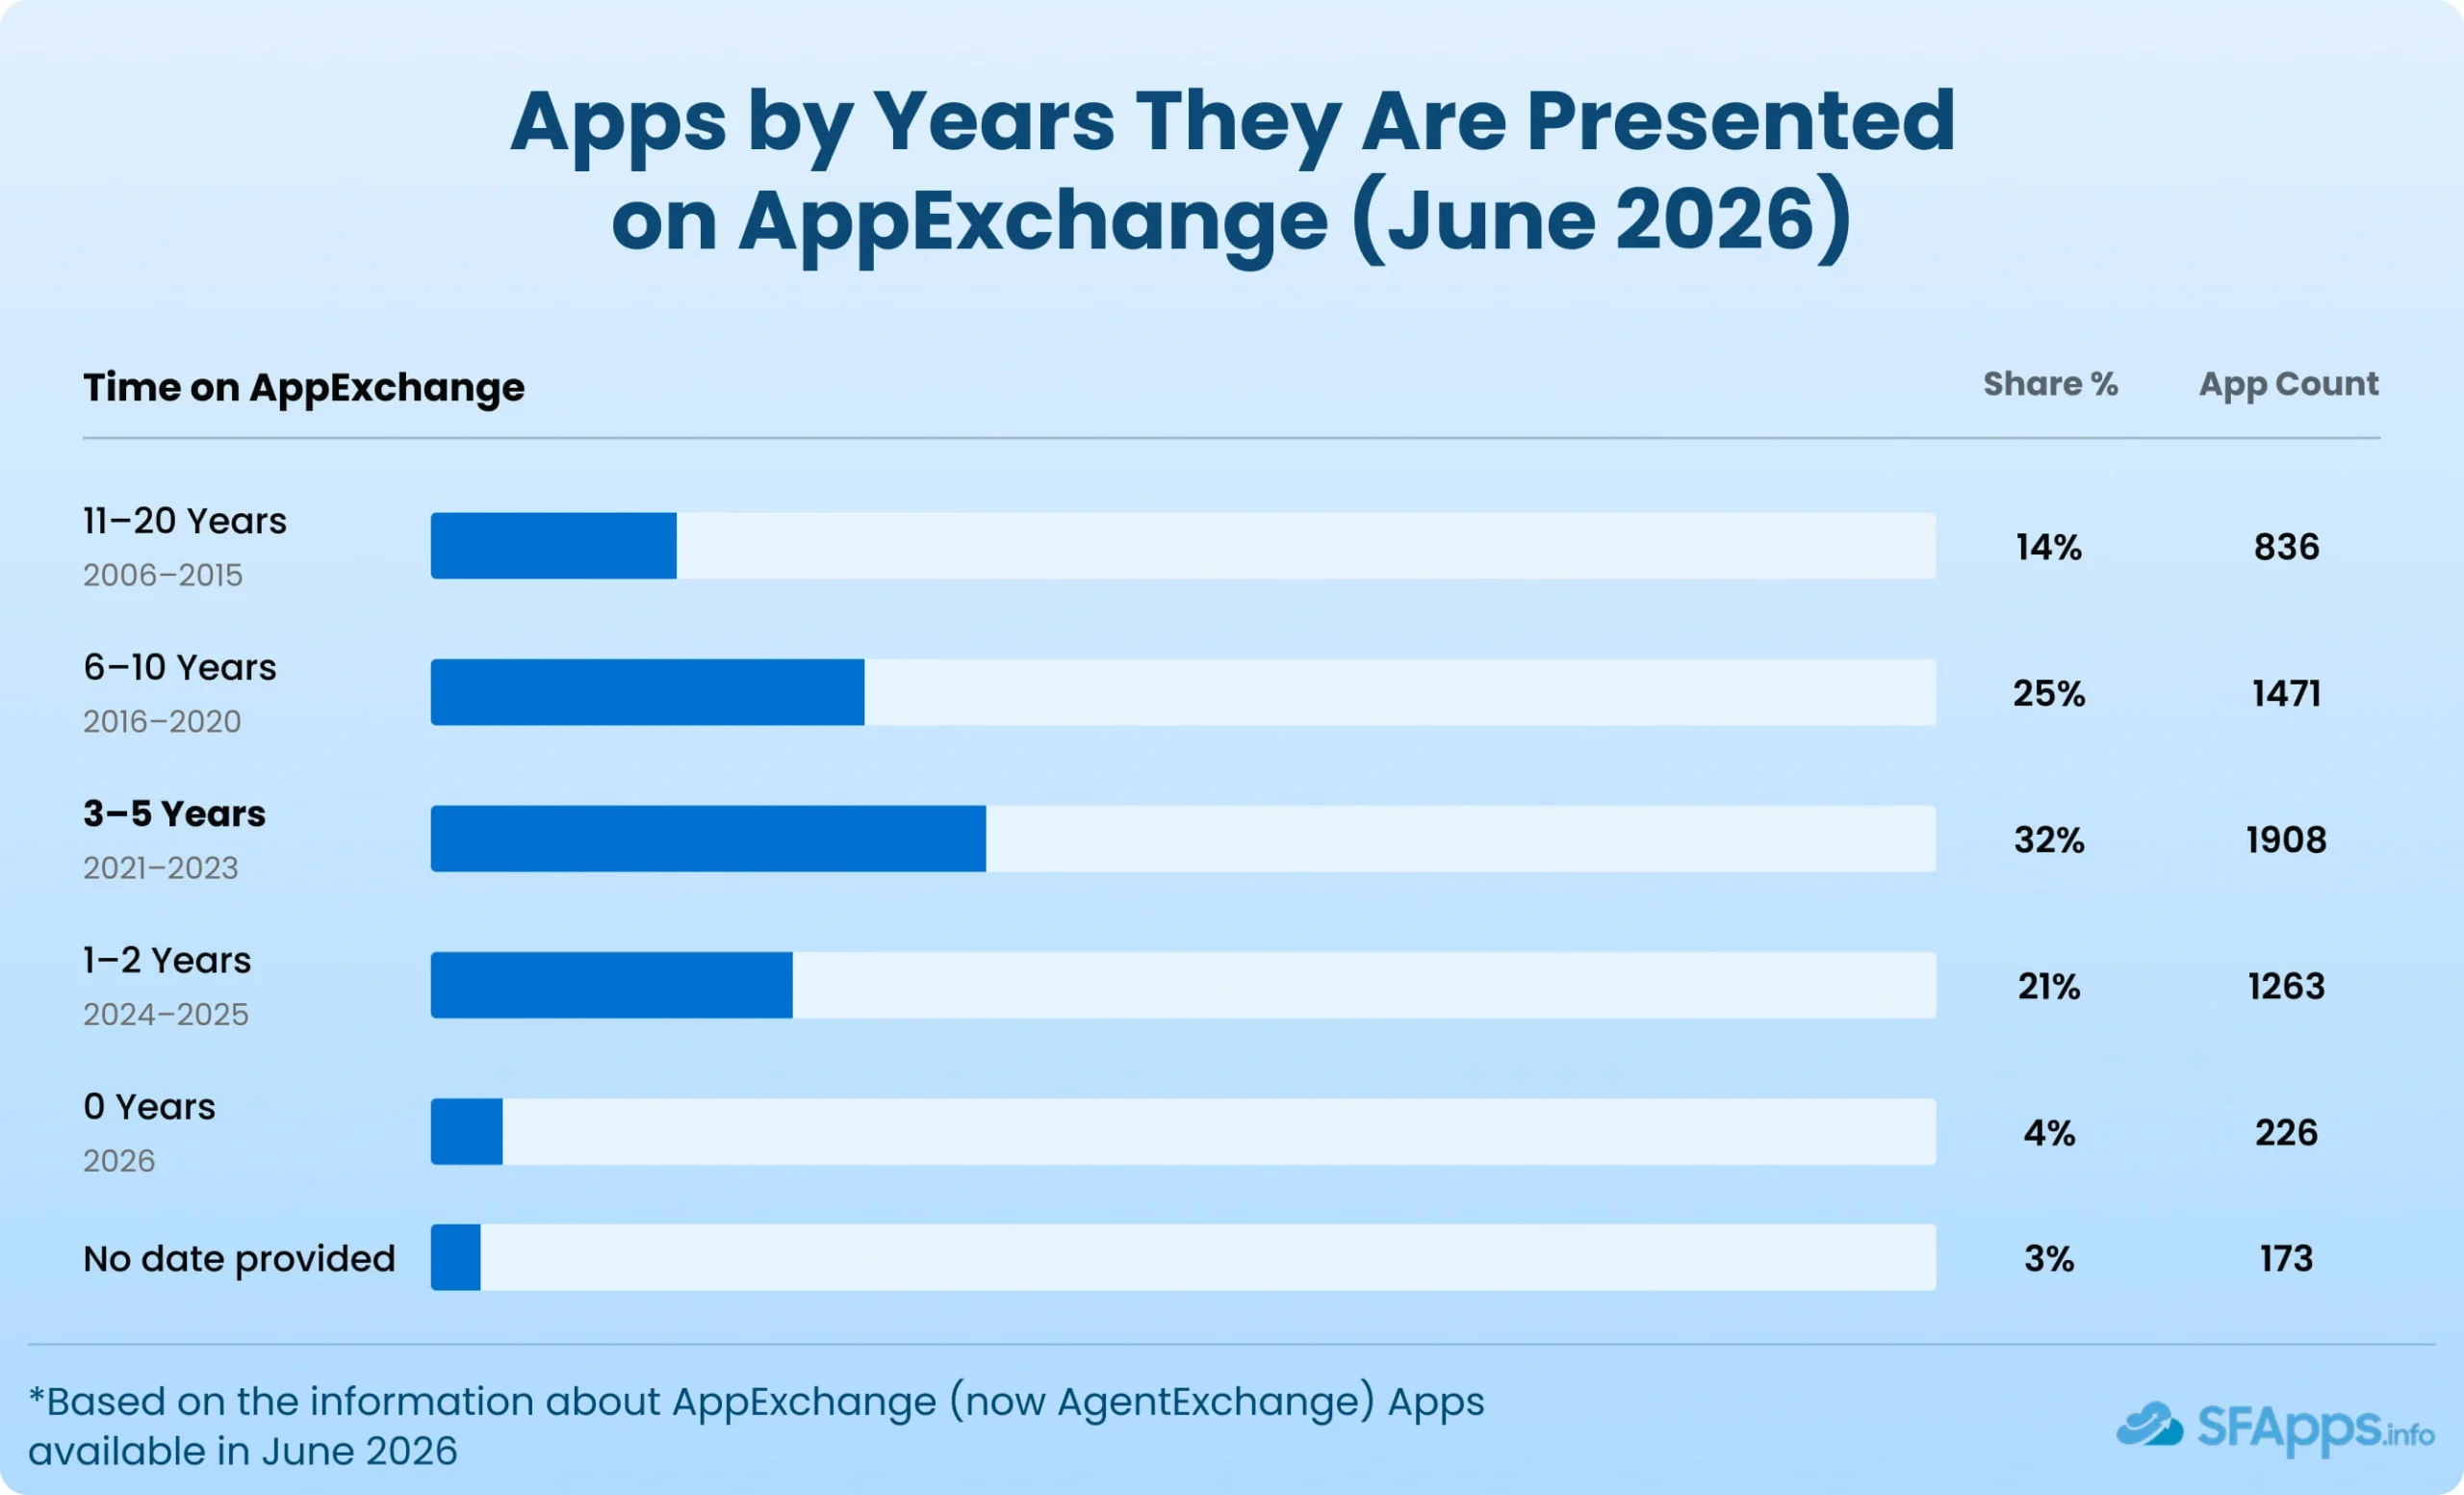
This dashboard shows that the largest group is not the newest apps. Apps first listed from 2021 to 2023 make up 1,908 listings, or 32% of the dataset. Another 1,471 apps, or 25%, have been present for 6 to 10 years.
The oldest group is also quite large. In June 2026, 836 apps, or 14% of the dataset, had been present for 11 to 20 years. Newer listings are still visible in the data, but they do not dominate the public catalog. Apps first listed in 2024 and 2025 make up 1,263 listings, or 21%. Apps first listed in 2026 make up 226 listings, or 4%. For 173 apps, no listing date was available.
It’s interesting that, over the marketplace’s 20-year history, apps listed in the last 10 years account for 83% of all public listings in our dataset.
The second dashboard takes this one level deeper and shows the 20 oldest public app listings in the June 2026 dataset.
| Salesforce AppExchange Oldest Apps | ||||||
|---|---|---|---|---|---|---|
| № | App Name | Listed On | Developer | Reviews | Rating | Main Category |
| 1 | Recruiting Manager | 01/08/2006 | Salesforce Labs | 11 | 2.36 | ERP |
| 2 | Recruiting App | 01/08/2006 | Salesforce Labs | 22 | 2.68 | ERP |
| 3 | Procurement | 01/08/2006 | Salesforce Labs | 6 | 3.83 | Finance |
| 4 | Budgeting and Purchasing | 01/08/2006 | Salesforce Labs | 4 | 4 | Finance |
| 5 | Class Enrollment | 01/08/2006 | Salesforce Labs | 19 | 4.05 | ERP |
| 6 | Bug Tracking and Quality Assurance | 01/08/2006 | Salesforce Labs | 10 | 4.1 | IT & Administration |
| 7 | Conference Management | 01/08/2006 | Salesforce Labs | 4 | 4.25 | Marketing |
| 8 | Doc Notes | 01/08/2006 | Salesforce Labs | 2 | 5 | Productivity |
| 9 | Channel Plans | 01/08/2006 | Salesforce Labs | 0 | 0 | Sales |
| 10 | FPX Intelliquip Selling Cloud | 01/09/2006 | FPX Intelliquip | 60 | 4.3 | Sales |
| 11 | Sage Intacct Accounting and ERP | 01/16/2006 | Sage Intacct | 140 | 4.28 | Finance |
| 12 | Altify Opportunities | 100% Salesforce Native Deal Management | 01/16/2006 | Altify, LLC | 91 | 4.7 | Sales |
| 13 | EDVantage lite | 03/17/2006 | Idealist Consulting | 0 | 0 | Sales |
| 14 | LinkPoint Connect – IBM Notes Email Integration and Sync Tools | 04/18/2006 | LinkPoint360 | 6 | 5 | Productivity |
| 15 | Xactly Incent®: Incentive Compensation and Commissions Management | 05/24/2006 | Xactly Corporation | 171 | 4.68 | Finance |
| 16 | Metazoa Snapshot – The Ultimate Org Management Toolbox | 05/25/2006 | Metazoa | 54 | 4.98 | IT & Administration |
| 17 | Service & Support Dashboards | 08/15/2006 | Salesforce Labs | 15 | 4.07 | Customer Service |
| 18 | Employee Manager | 08/25/2006 | Salesforce Labs | 18 | 3.44 | ERP |
| 19 | Demandbase One for Sales | 08/30/2006 | Demandbase, Inc | 246 | 4.73 | Sales |
| 20 | Lead and Opportunity Management Dashboards | 09/07/2006 | Salesforce Labs | 6 | 4.17 | Analytics |
| *Based on the information about AppExchange (now AgentExchange) Apps available in June 2026 | ||||||
The oldest visible apps mostly come from the first year of AppExchange. Several were listed on January 8, 2006, and many of them belong to Salesforce Labs. Their presence is not surprising because Salesforce Labs has the largest portfolio on the marketplace, which we will also see later in the developer section.
What is more interesting is the mix of categories. The oldest list includes ERP, Finance, Sales, IT & Administration, Marketing, Productivity, Customer Service, and Analytics. In other words, early AppExchange listings were not only about sales tools. They already covered recruiting, purchasing, support dashboards, finance, document notes, and reporting examples.
Review counts also vary a lot. It’s curious that some of the oldest apps have few or no reviews at all, while others show stronger public feedback. Demandbase One for Sales has 246 reviews, Xactly Incent has 171, Sage Intacct Accounting and ERP has 140, and Altify Opportunities has 91.
Insight:
This is a useful reminder for buyers.
App age alone is not a quality signal.
An old listing can still be relevant, but it should be checked together with reviews, rating, documentation, product fit, and vendor activity.
New apps need the same type of check, just from the other side: they may solve newer problems, but they often have less public feedback.
Salesforce AppExchange Apps by Business Need: A Market That Moves Unevenly
After looking at the age of listings, let’s return to the present and see which apps are currently leading the market. A breakdown by AppExchange business need categories helps answer that. It shows not only the number of apps in each category, but also where public app coverage increased or decreased over the last year.
In this snapshot, 5,468 of 5,877 public app listings had at least one Business Need category assigned, or about 93% of the dataset.
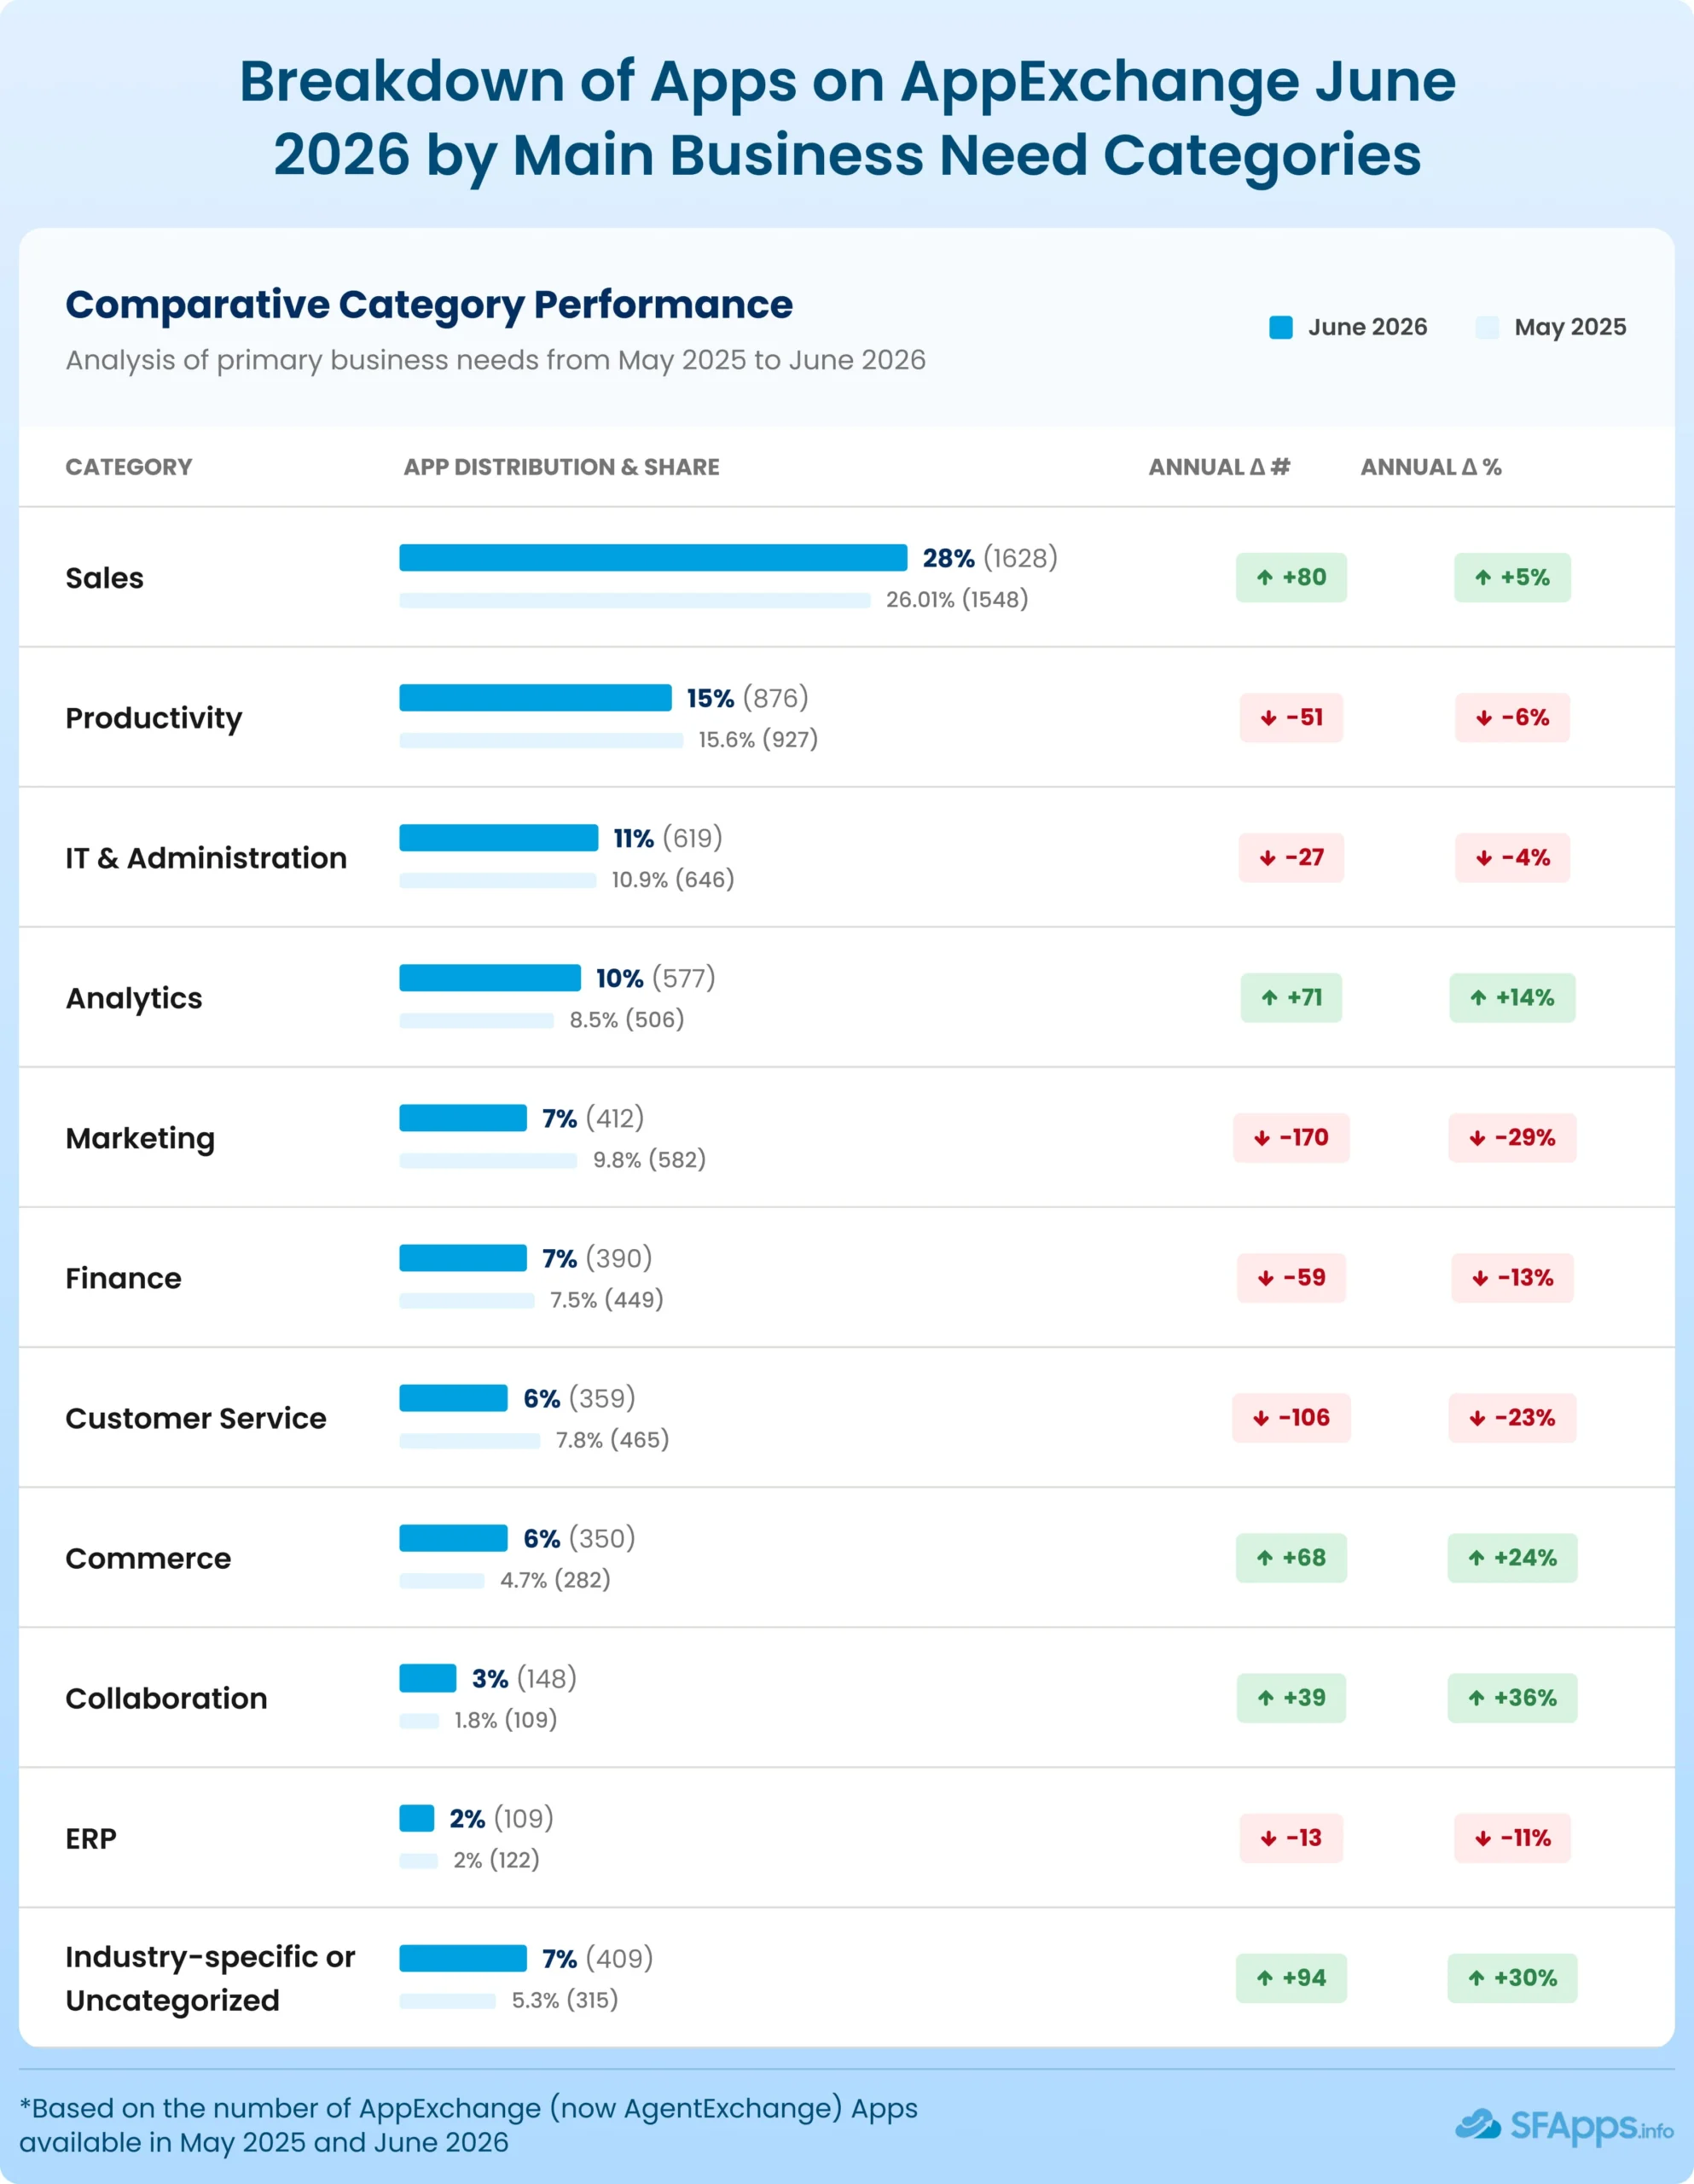
Sales is still the largest category by a clear margin. In June 2026, it had 1,628 apps, or 28% of the marketplace. This is 80 more apps than in May 2025. That result is not surprising. Salesforce started as a sales CRM, and sales teams still need many connected tools for quoting, lead management, documents, territory work, communication, and forecasting.
Productivity is the second-largest category, with 876 apps, followed by IT & Administration with 619 apps and Analytics with 577 apps. Together, these groups show where many Salesforce AppExchange apps are still concentrated: sales work, daily user productivity, admin work, and data analysis. In simple terms, this is where the Salesforce AppExchange tools market is most crowded.
But the market did not move in one direction. Analytics grew by 71 apps, or 14%. Commerce grew by 68 apps, or 24%. Collaboration grew by 39 apps, or 36%, making it the fastest-growing business need category by percentage. Industry-specific or Uncategorized apps also grew strongly, adding 94 apps, or 30%.
At the same time, several familiar categories became smaller in the public dataset. Marketing lost 170 apps, the largest decline by number of listings. Customer Service decreased by 106 apps, Finance by 59, Productivity by 51, IT & Administration by 27, and ERP by 13. For the May 2025 category reference, you can read full analysis of that earlier snapshot.
I would be careful with reading these declines as lower demand. A smaller category can mean different things. Some apps may have been removed, moved to private listings, reworked, or classified differently. It can also reflect cleanup in public listings after the move toward AgentExchange.
There are also still areas with no visible app coverage. In IT & Administration, Augmented Reality & Virtual Reality, and Content Delivery Network still had no apps as of June 2026. These are small signals, but they show that even a large marketplace still has gaps.
For buyers, this business need view is useful because it shows where comparison will be harder. In Sales, Productivity, IT & Administration, and Analytics, the number of options is large. In smaller or shrinking categories, the question is different: is there enough choice?
AppExchange Market Analysis by Industry: Where Vendors Want to Be Found
Business need categories show what apps do. Industry tags show where vendors want those apps to be found. This matters because a Salesforce admin in Financial Services, Healthcare, Retail, or Manufacturing will often start the search from an industry view, not only from a feature category.
In June 2026, 3,015 of 5,877 public app listings had at least one Industry category assigned, up from 2,577 of 5,951 apps in May 2025. This means industry-tagged coverage increased from about 43% to 51% of public listings. The AppExchange marketplace overview 2025 gives the earlier baseline for this industry comparison.
One note before reading the chart: an app can be connected with more than one industry. So these numbers should be read as industry coverage, not as a count of unique apps by industry.
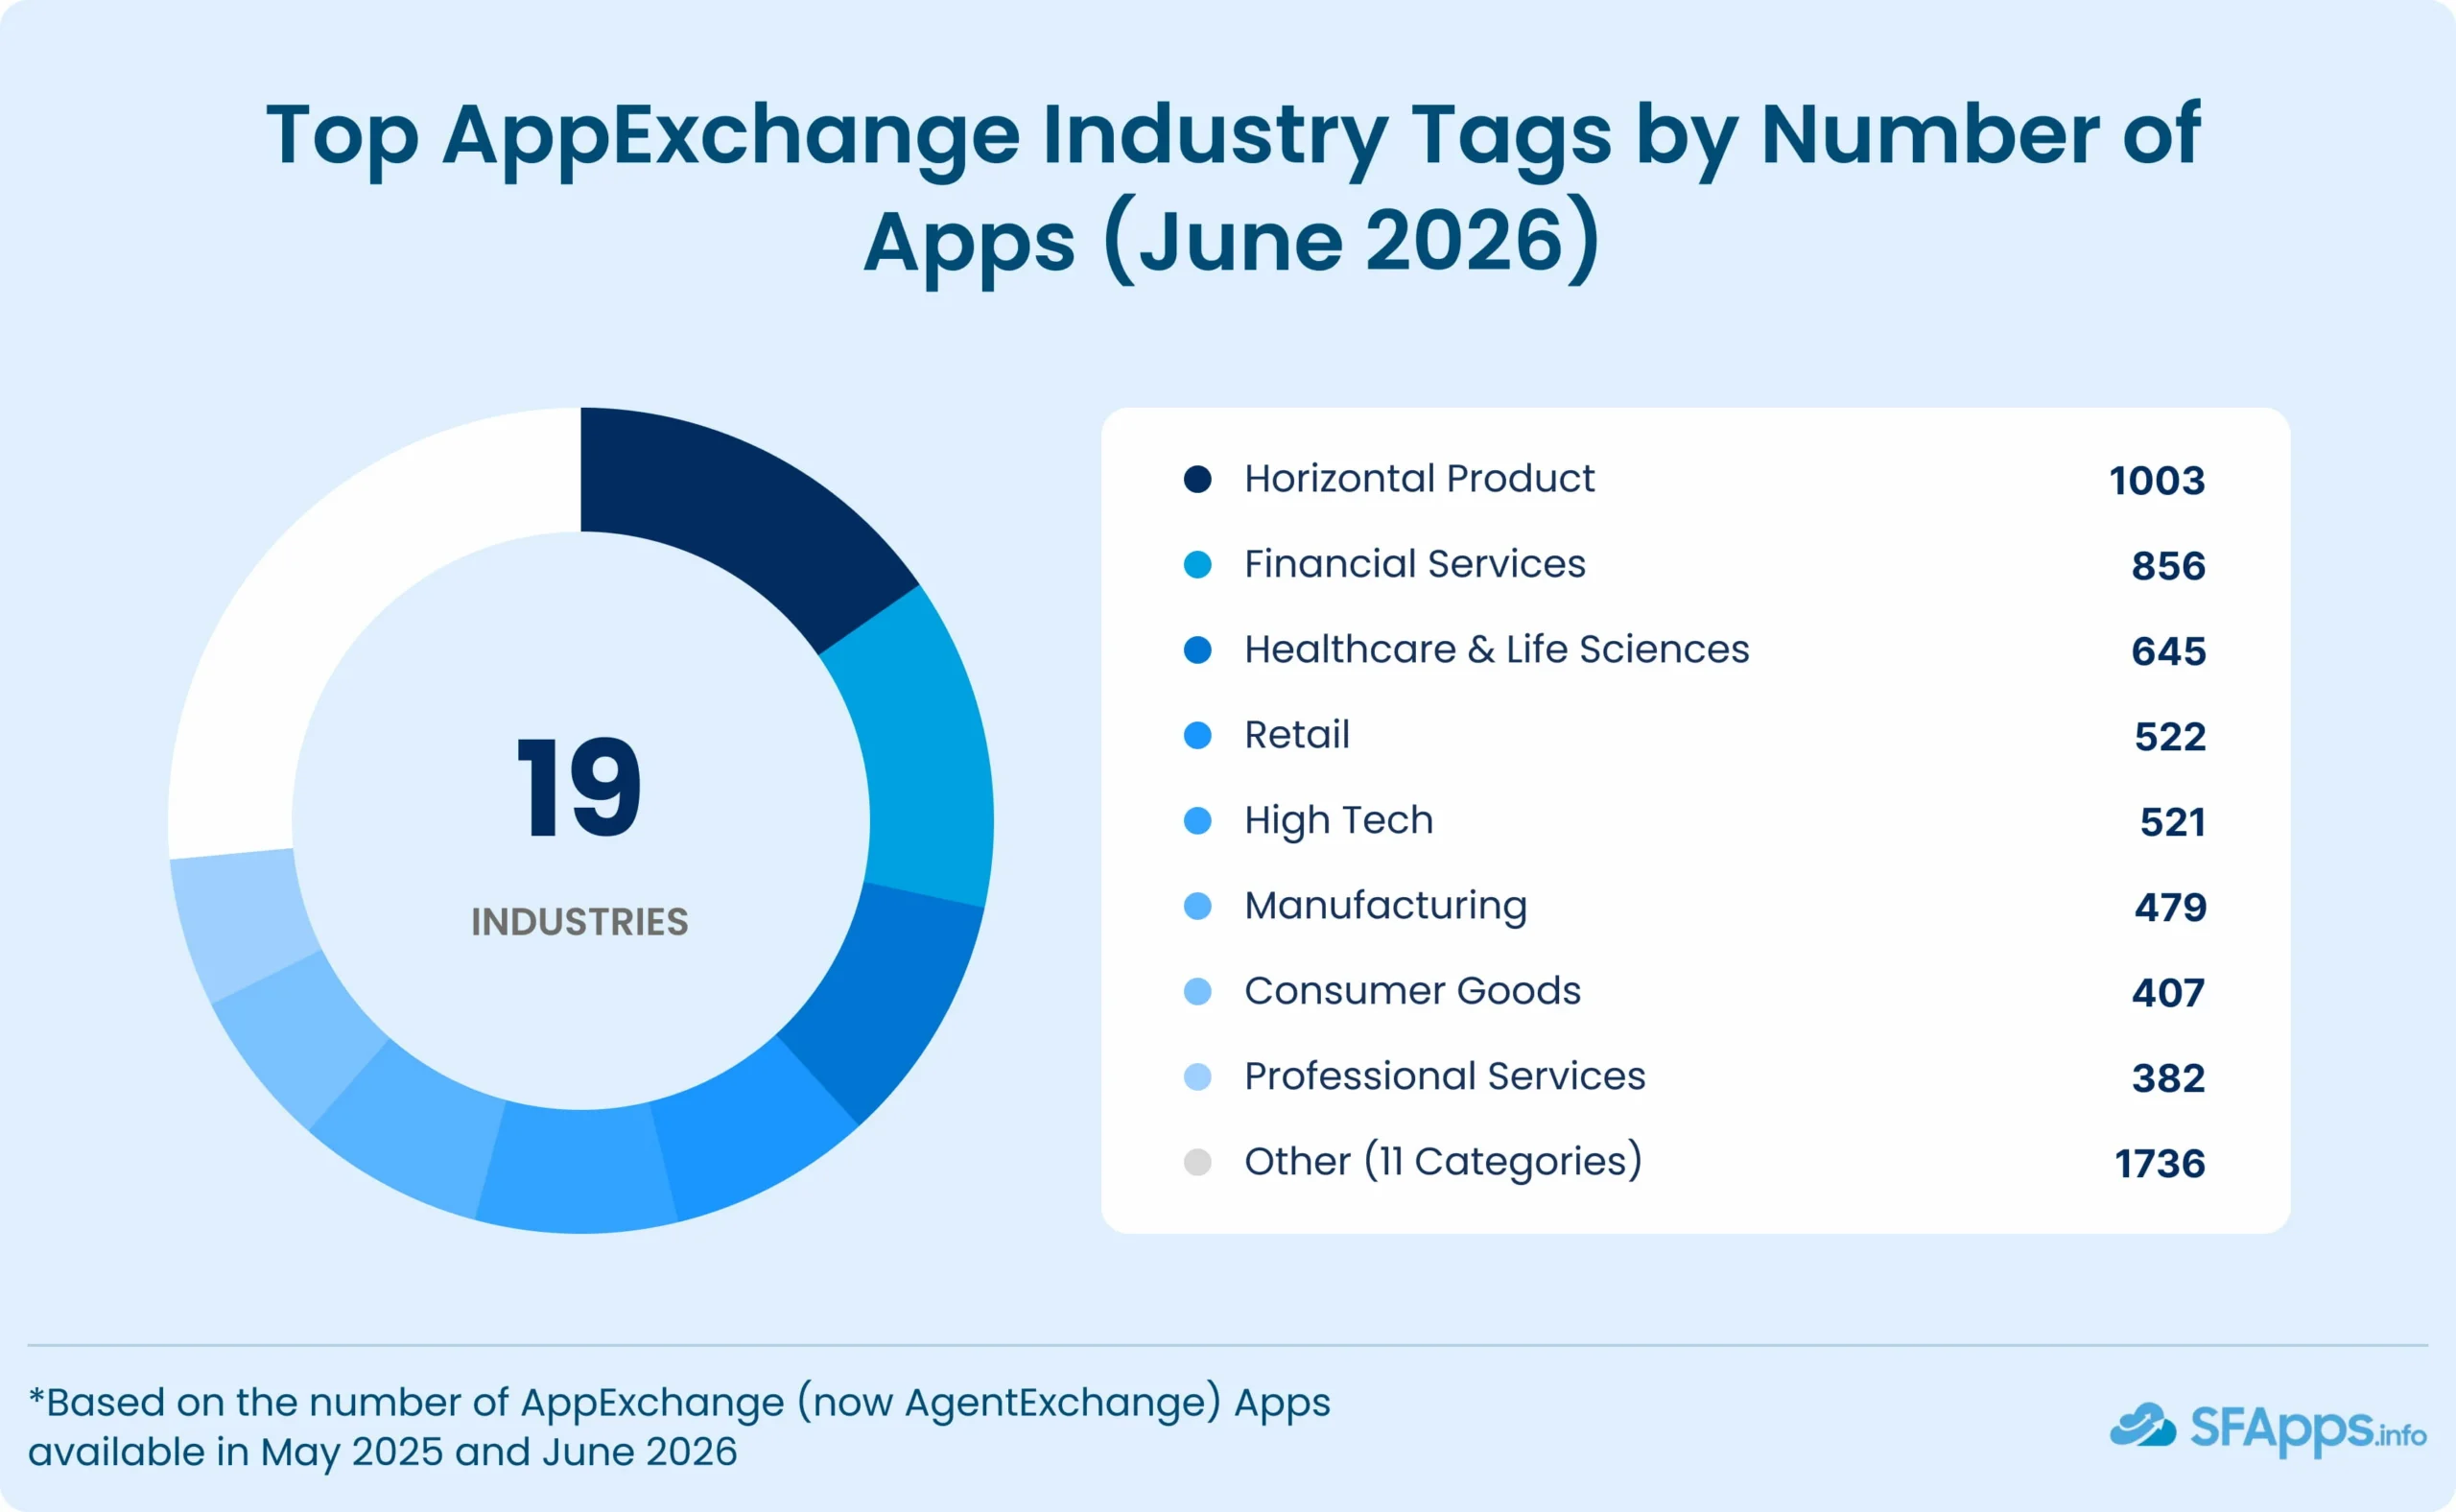
Horizontal Product is the largest group, with 1,003 apps. This usually means tools that can work across many types of companies, instead of apps built for one specific industry. Financial Services follows with 856 apps, and Healthcare & Life Sciences has 645 apps. These two groups are not surprising, because both industries often need many Salesforce extensions around customer data, compliance, service processes, documents, and reporting.
Retail, High Tech, Manufacturing, and Consumer Goods also stay near the top. Retail has 522 apps, High Tech has 521, Manufacturing has 479, and Consumer Goods has 407. These are areas where Salesforce customers often need extra tools around sales operations, partner work, commerce, field teams, service, and analytics.
The fastest growth tells another part of the story. Nonprofit grew by 49%, from 106 to 158 apps. Energy grew by 35%, from 65 to 88 apps. Professional Services and High Tech both grew by 23%. Agriculture & Mining also grew by 21%, although it remains the smallest industry group with only 35 apps.
| AppExchange Industries Breakdown by Number of Apps Presented (June 2026) | |||||
|---|---|---|---|---|---|
| Industry | # of Apps(May 2025) | # of Apps(June 2026) | % of Industry-Tagged Apps(June 2026) | Difference in 12 months, # | Difference in 12 months, % |
| Horizontal Product | 853 | 1003 | 33.27% | +150 | +18% |
| Financial Services | 727 | 856 | 28.39% | +129 | +18% |
| Healthcare & Life Sciences | 553 | 645 | 21.39% | +92 | +17% |
| Retail | 485 | 522 | 17.31% | +37 | +8% |
| High Tech | 425 | 521 | 17.28% | +96 | +23% |
| Manufacturing | 403 | 479 | 15.89% | +76 | +19% |
| Consumer Goods | 357 | 407 | 13.50% | +50 | +14% |
| Professional Services | 311 | 382 | 12.67% | +71 | +23% |
| Engineering, Construction, & Real Estate | 217 | 249 | 8.26% | +32 | +15% |
| Education | 216 | 243 | 8.06% | +27 | +13% |
| Travel, Transportation, & Hospitality | 194 | 216 | 7.16% | +22 | +11% |
| Communications | 168 | 186 | 6.17% | +18 | +11% |
| Government | 167 | 176 | 5.84% | +9 | +5% |
| Nonprofit | 106 | 158 | 5.24% | +52 | +49% |
| Automotive | 133 | 148 | 4.91% | +15 | +11% |
| Public Sector | 115 | 133 | 4.41% | +18 | +16% |
| Media & Entertainment | 99 | 104 | 3.45% | +5 | +5% |
| Energy | 65 | 88 | 2.92% | +23 | +35% |
| Agriculture & Mining | 29 | 35 | 1.16% | +6 | +21% |
| *Based on the number of AppExchange (now AgentExchange) Apps available in May 2025 and June 2026 | |||||
For vendors, smaller industry groups may be worth a closer look. A small industry count can mean less competition, but it can also mean a smaller market or a harder sales process.
For buyers, the question is different. If your industry has fewer apps, you may need to compare general Salesforce tools with industry-specific apps and check whether the vendor really understands your use case.
Industry tagging also needs a careful reading. Some apps are truly built for a specific industry. Others can serve several industries and use multiple tags because their functionality is more general. That is not a problem by itself, but it means the industry tag should be treated as a starting point, not as a guarantee that the app fits the use case.
Salesforce Product Coverage in the Salesforce App Marketplace
Business need categories show what apps are meant to solve. Industry tags show where vendors want to appear. Product tags add one more layer: which Salesforce products these apps are connected with.
In June 2026, 4,258 of 5,877 public app listings had at least one Salesforce Product tag assigned, or about 72% of the dataset.
As with industry tags, one app can be connected with more than one Salesforce product.
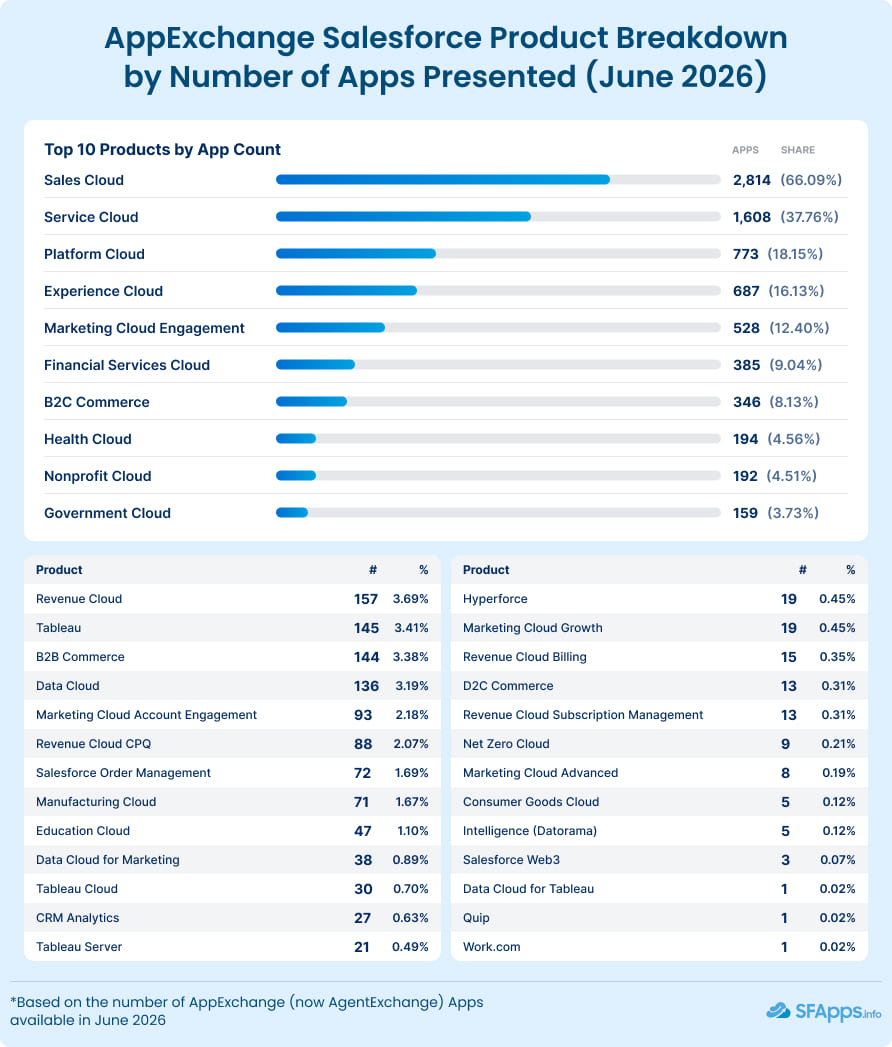
Sales Cloud has the strongest product coverage, with 2,814 apps, or 66.09% of product-tagged apps in this chart. Service Cloud follows with 1,608 apps, or 37.76%. Together, these two products show how strongly the marketplace is connected with core CRM use cases.
This again shows how closely the marketplace follows the main CRM use cases. Sales and service teams usually need many extra tools around communication, documents, routing, reporting, automation, forecasting, customer support, and integrations. So it makes sense that Sales Cloud and Service Cloud attract the largest number of related app listings.
The next group is also quite practical. Platform Cloud has 773 apps, Experience Cloud has 687, and Marketing Cloud Engagement has 528. These are product areas where customers often build custom workflows, portals, marketing processes, and connected customer experiences.
After that, the numbers become smaller. Financial Services Cloud has 385 apps, B2C Commerce has 346, Health Cloud has 194, Nonprofit Cloud has 192, and Government Cloud has 159. These are still visible groups, but they are far behind Sales Cloud and Service Cloud.
The middle of the table is also worth attention. Revenue Cloud has 157 apps, Tableau has 145, B2B Commerce has 144, Data Cloud has 136, Marketing Cloud Account Engagement has 93, and Revenue Cloud CPQ has 88. These numbers show that newer, more specific, or more specialized product areas have app coverage, but not at the same level as the core CRM products. For the broader 2025 view of the same marketplace, you can read full analysis from that earlier report.
Insight:
Salesforce product names and packaging can change over time. For example, Salesforce now presents Data 360 as the new name for Data Cloud,
and Agentforce Revenue Management as the new name for Revenue Cloud.
Our dashboard uses the product tags from AppExchange, so product tags should be read as marketplace metadata, not as a final map of Salesforce products.
At the bottom of the table, some product groups have very low app counts. Net Zero Cloud has 9 apps, Marketing Cloud Advanced has 8, Consumer Goods Cloud and Intelligence (formerly Datorama) have 5 each, Salesforce Web3 has 3, while Data Cloud for Tableau, Quip, and Work.com show only 1 app each.
For buyers, this section gives a practical hint. If your project is based on Sales Cloud or Service Cloud, the number of app options will usually be much larger. If your project uses a smaller or newer product area, you may need to search more widely, compare cross-product tools, and check whether the app really supports your Salesforce setup.
Salesforce App Ecosystem: Fewer Developers, but Multi-App Publishers Stay Strong
After categories, industries, and products, it is useful to look at the companies behind the apps. The June 2026 data shows a smaller developer base than one year earlier, but it also shows that multi-app publishers still play a strong role in the marketplace.
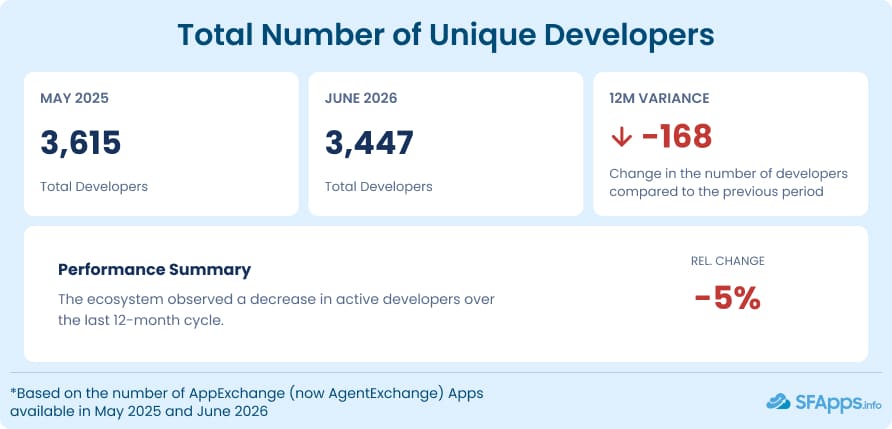
In June 2026, we counted 3,447 unique developers. In May 2025, there were 3,615. So the number of visible developers decreased by 168, or 5%. The Salesforce AppExchange stats 2025 help put this shift into context by showing the earlier developer baseline.
This follows the same direction we saw in the first market overview: fewer visible apps, fewer visible developers, and fewer total reviews compared with May 2025. Again, I would not read this only as a market decline. Some listings may have been removed, moved to private listings, or changed in a way that moved them outside the public dataset.
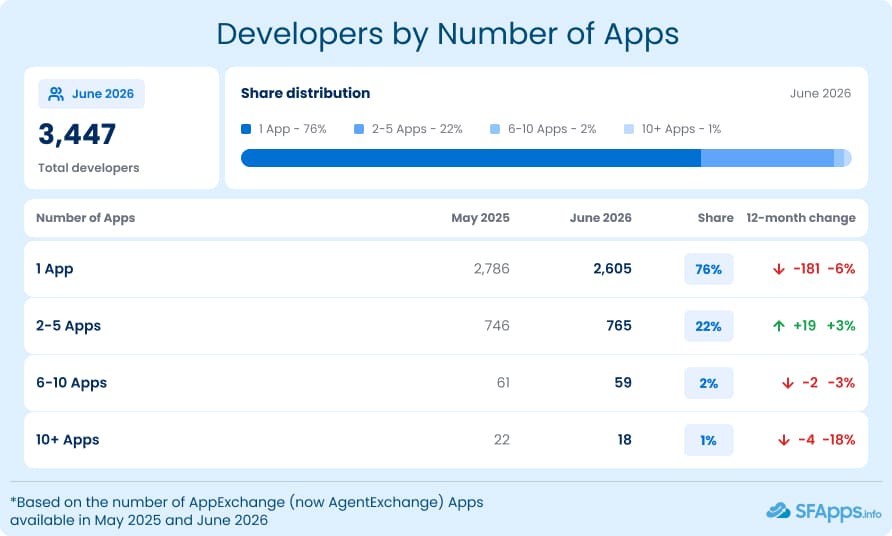
The developer structure is still heavily weighted toward small portfolios. In June 2026, 2,605 developers had only one app. That is 76% of all developers in the dataset. Another 765 developers had 2 to 5 apps, which represents 22%.
The interesting part is that the 2 to 5 app group was the only group that grew compared with May 2025. It increased by 19 developers, or 3%. Developers with one app decreased by 181, while developers with 6 to 10 apps and 10 or more apps also decreased slightly.
So the marketplace is not simply moving toward very large publishers. It still has many single-app vendors, but the middle group of small portfolios became a bit stronger. For buyers, this matters because a developer with several apps may have more marketplace experience, but it still does not automatically mean that every app is strong.
| Top 10 Developers by Number of Apps (June 2026) | |||||
|---|---|---|---|---|---|
| № | Developer | Number of Apps | Total Reviews | Avg Rating | Was in Top 10 developers in May 2025? |
| 1 | Salesforce Labs | 536 | 5852 | 3.49 | Yes |
| 2 | Astrea IT Services Pvt Ltd | 46 | 355 | 3.89 | Yes |
| 3 | Commercient LLC | 39 | 209 | 4.98 | Yes |
| 4 | Salesforce | 22 | 515 | 2.91 | Yes |
| 5 | Cloud Maven, Inc | 16 | 173 | 4.98 | No |
| 6 | CRM.Team™ | 16 | 89 | 4.65 | Yes |
| 7 | BoonPlus | 15 | 33 | 5 | Yes |
| 8 | Satrang Technologies | 15 | 381 | 4.86 | Yes |
| 9 | Certinia | 14 | 308 | 4.71 | No |
| 10 | OSF Digital | 14 | 9 | 4.75 | Yes |
| *Based on the number of AppExchange (now AgentExchange) Apps available in May 2025 and June 2026 | |||||
The top developer list makes this point even clearer. Salesforce Labs is far ahead, with 536 apps. The next developer, Astrea IT Services Pvt Ltd, has 46 apps, followed by Commercient LLC with 39 apps and Salesforce with 22 apps.
After that, the numbers are much smaller. Cloud Maven, Inc and CRM.Team™ each have 16 apps. BoonPlus and Satrang Technologies each have 15. Certinia and OSF Digital each have 14.
But portfolio size and user feedback are different signals. Salesforce Labs has the largest number of apps and 5,852 total reviews, but its average rating is 3.49. Commercient LLC has 209 total reviews and a 4.98 average rating.
Satrang Technologies has 15 apps and 381 reviews, while OSF Digital has 14 apps and only 9 total reviews.
For Salesforce buyers, the practical lesson is simple: do not judge a vendor only by the number of apps. A large portfolio can show experience and long marketplace presence. Reviews, rating, app freshness, documentation, and product fit still need to be checked separately.
AppExchange App Analytics: Reviews, Ratings, and the Apps Buyers Already Know
After looking at apps, categories, products, and developers, we get to one of the most practical parts for buyers: reviews and ratings. When someone compares apps on AppExchange, public feedback often becomes the first trust signal. But the June 2026 data shows that this signal is still limited for many listings.
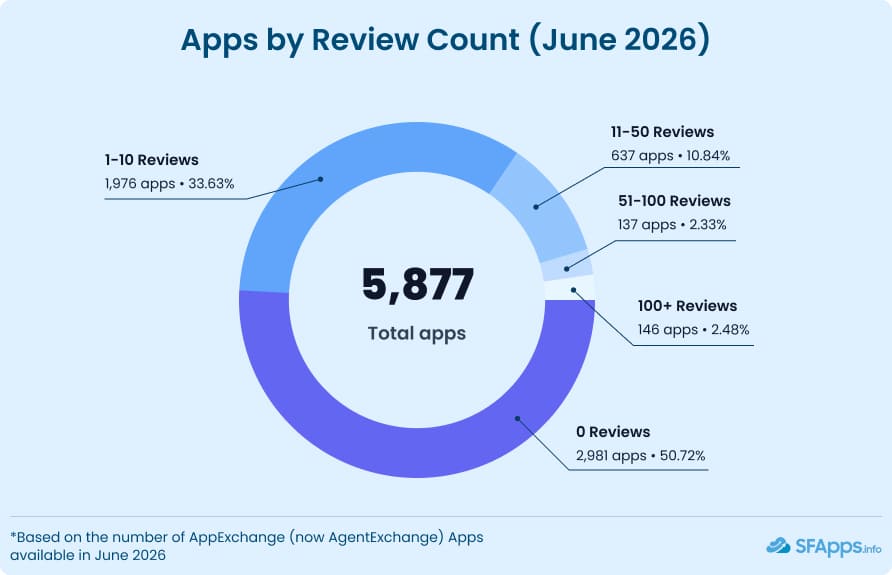
Salesforce AppExchange analytics becomes practical for buyers, because reviews and ratings help explain what the raw app count cannot show. In June 2026, 2,981 apps had no reviews. That is 50.72% of all public app listings in our dataset. Another 1,976 apps had only 1 to 10 reviews, or 33.63%.
So, most apps either have no reviews or only a small number of reviews. Only 637 apps had 11 to 50 reviews, and only 137 apps had 51 to 100 reviews. The high-review group is very small: 146 apps had more than 100 reviews, which is only 2.48% of the dataset.
For buyers, this is important. A low review count does not automatically mean that an app is weak. Some apps may be new, specialized, or sold mostly through direct relationships. But it does mean that public feedback may not be enough for evaluation. In such cases, buyers need to check documentation, release history, support model, security review status, demos, and vendor experience more carefully.
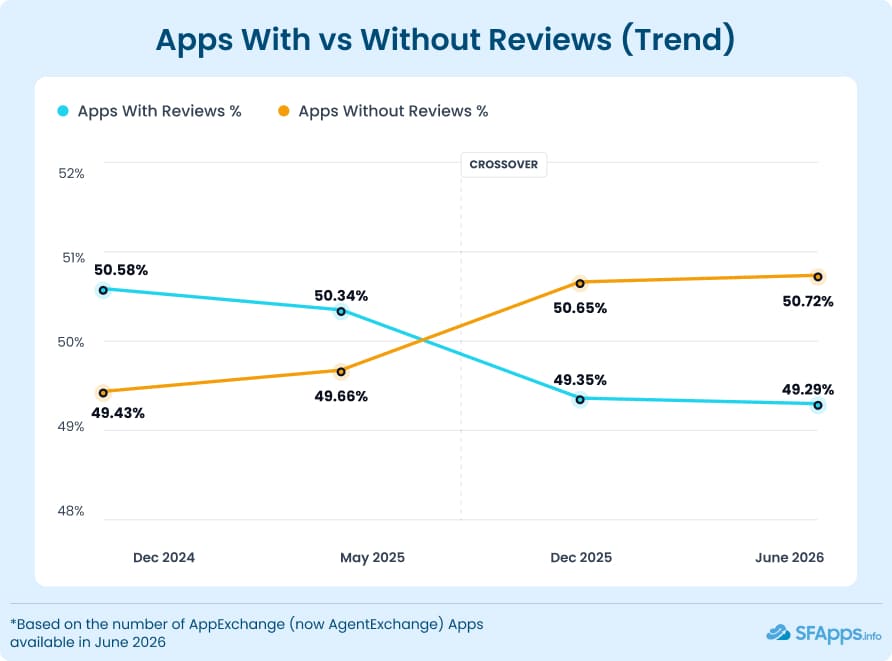
The trend also shows that the review gap is not closing. For the earlier review baseline, you can read full analysis from the 2024 snapshot. In December 2024, 49.43% of Salesforce apps had no reviews. In May 2025, the share was 49.66%. In December 2025, it crossed 50%, and in June 2026, it reached 50.72%.
The change is not dramatic, but the direction is clear. The public marketplace still has a large group of apps without visible user feedback. This makes review depth one of the most important parts of AppExchange app analytics, especially when several apps look similar in features and positioning.
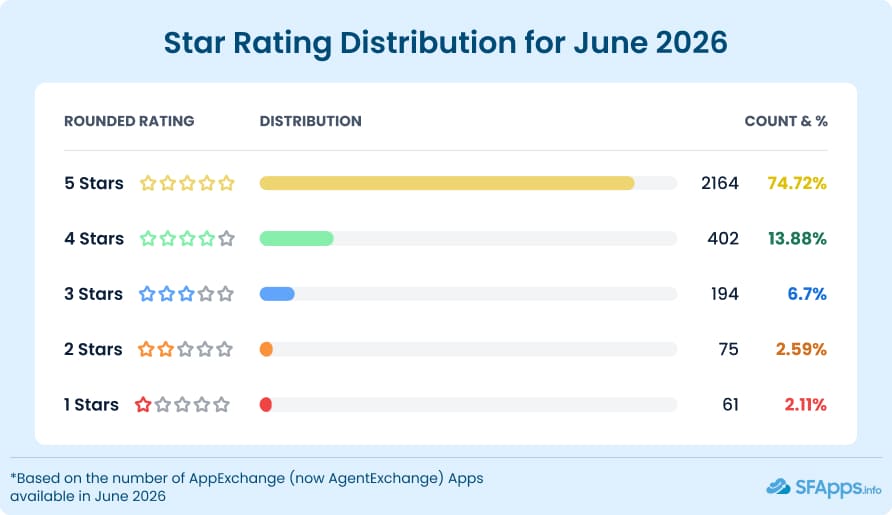
Ratings tell a similar story, but from another angle. In June 2026, 2,164 apps had a rounded 5-star rating. At first, this sounds very positive. But the context matters: 2,981 apps had no rating at all because they had no reviews.
There were also 402 apps with a rounded 4-star rating, 194 with 3 stars, 75 with 2 stars, and 61 with 1 star. So the visible rating distribution is strongly shaped by apps that already have some reviews.
A 5-star rating should also not be read alone. A 5-star app with two reviews is very different from a 4.8-star app with hundreds of reviews. The rating is useful, but the number of reviews behind it is just as important.
| Salesforce AppExchange Top 10 Apps by Reviews (June 2026) | ||||||
|---|---|---|---|---|---|---|
| № | App Name | Developer | Reviews | Rating | Main Category | Was in Top 10 apps in May 2025? |
| 1 | Docusign eSignature for Salesforce: The trusted eSignature solution | Docusign, Inc** | 4647 | 4.55 | Customer Service | Yes |
| 2 | Adobe Acrobat Sign eSignatures for Salesforce | Adobe | 3200 | 4.86 | Sales | Yes |
| 3 | Cirrus Insight for Gmail | Cirrus Insight | 2094 | 4.7 | Sales | Yes |
| 4 | 360 SMS App for Salesforce Messaging – Send SMS | WhatsApp from Salesforce | CTI | 360 Degree Cloud Technologies Pvt. Ltd. | 1277 | 4.89 | Sales | Yes |
| 5 | SMS Magic & Conversive | Conversational Messaging | Screen Magic Mobile Media | 1133 | 4.82 | Sales | Yes |
| 6 | Vonage for Service Cloud Voice and Contact Center, CTI, Speech Analytics (BYOT) | Vonage | 1039 | 4.93 | Customer Service | Yes |
| 7 | Conga Composer Salesforce Connector | document generation for anyone, anywhere | Conga | 946 | 4.74 | Sales | Yes |
| 8 | Geopointe for Salesforce: Territory Mapping, Routing & Field Sales Planning | Ascent Cloud LLC | 930 | 4.9 | Sales | Yes |
| 9 | Salesforce Adoption Dashboards | Salesforce Labs | 841 | 4.6 | IT & Administration | Yes |
| 10 | Talkdesk for Salesforce | AI Contact Center | Agentic AI | CTI | Analytics | Talkdesk | 699 | 4.66 | Customer Service | No |
| *Based on the number of AppExchange (now AgentExchange) Apps available in June 2026 | ||||||
The top reviewed apps show another side of the market. These are not random listings. They are mostly mature tools connected to everyday Salesforce work: e-signature, email integration, messaging, CTI, document generation, mapping, adoption dashboards, and contact center tools.
Docusign eSignature for Salesforce leads the list with 4,647 reviews. Adobe Acrobat Sign follows with 3,200 reviews, and Cirrus Insight for Gmail has 2,094. After that, 360 SMS, SMS Magic & Conversive, Vonage, Conga Composer, Geopointe, Salesforce Adoption Dashboards, and Talkdesk complete the top 10.
Another interesting detail is stability. Most apps in the June 2026 top 10 were already in the May 2025 top 10. This shows that review leadership changes slowly. Once an app builds a large review base, it becomes difficult for newer or smaller apps to catch up quickly.
For buyers, the practical takeaway is simple: reviews and ratings are useful, but they need context. A strong rating, a high review count, recent feedback, and a clear product fit should be read together. One number is rarely enough.
AppExchange Stats June 2026: Key Numbers From the Market Snapshot
Before closing the article, let’s collect the main June 2026 numbers in one place. These figures give a quick view of the public AppExchange snapshot we reviewed.
Marketplace size:
- 5,877 public app listings were visible in the June 2026 dataset. The visible app count decreased by 74 apps compared with May 2025.
- 3,447 unique developers were present in the dataset.
- Total reviews reached 77,517, while the average number of reviews per app stayed at 13.
Business need categories:
- 5,468 apps had at least one Business Need category assigned, or about 93% of the dataset.
- Sales remained the largest category, with 1,628 apps and 28% of the marketplace.
- Productivity followed with 876 apps, IT & Administration with 619 apps, and Analytics with 577 apps.
- Collaboration had the strongest percentage growth among business need categories, rising by 36%.
- Marketing had the largest decline by number of apps, down by 170 listings.
Industry coverage:
- 3,015 apps had at least one Industry category assigned, up from 2,577 in May 2025. So industry-tagged coverage increased from about 43% to 51% of public listings.
- Horizontal Product was the largest industry group, with 1,003 apps, or 33.27% of all industry-tagged apps.
- Financial Services followed with 856 apps, and Healthcare & Life Sciences had 645 apps. These two groups show strong coverage in these industries.
- Nonprofit had the strongest percentage growth, rising by 49%, while Energy grew by 35%. Both are still much smaller than the leading industry groups, but their growth is noticeable.
- Agriculture & Mining remained the smallest industry group, with only 35 apps.
Salesforce product coverage:
- 4,258 apps had at least one Salesforce Product tag assigned, or about 72% of the dataset.
- Sales Cloud had the strongest product coverage, with 2,814 apps, or 66.09% of product-tagged apps.
- Service Cloud followed with 1,608 apps, or 37.76% of product-tagged apps.
- Platform Cloud had 773 apps, Experience Cloud had 687 apps, and Marketing Cloud Engagement had 528 apps.
- Some product groups were still very small in this dataset. Salesforce Web3 had 3 apps, while Data Cloud for Tableau, Quip, and Work.com had only 1 app each.
Developer ecosystem:
- 3,447 unique developers were present in the June 2026 dataset, down from 3,615 in May 2025.
- 2,605 developers had only one app, which is 76% of all developers in the dataset.
- Developers with 2 to 5 apps represented 22% and were the only developer group that grew compared with May 2025.
- Salesforce Labs remained far ahead as the largest publisher, with 536 apps. The next two positions were Astrea IT Services Pvt Ltd with 46 apps and Commercient LLC with 39 apps.
Review coverage:
- 77,517 reviews were visible across public app listings in the June 2026 dataset.
- 2,981 apps had no reviews, which is 50.72% of the dataset.
- 1,976 apps had only 1 to 10 reviews.
- Only 146 apps had more than 100 reviews.
- Docusign eSignature for Salesforce was the most reviewed app, with 4,647 reviews.
Closing Thought: The Market Needs Context, Not Only a Bigger Number
After going through the data, the June 2026 picture looks more complex than a simple app count. The public marketplace has fewer visible apps than in May 2025, fewer visible developers, and slightly fewer total reviews. At the same time, some categories grew, some industry tags expanded, and many long-standing apps are still visible after many years on AppExchange.
So, how should we read this market snapshot?
- First, app count is useful, but it is not enough. A large category can give buyers more choice, but also more comparison work. A smaller category can make the search easier, but it may also mean fewer specialized options. Category growth can show where vendor activity is increasing, but it does not automatically prove stronger buyer demand. And when a category shrinks, it does not automatically mean that demand is weaker. It may reflect removed listings, private listings, reclassification, or cleanup in the public marketplace.
- Second, reviews and ratings need context. More than half of the public apps in our June 2026 dataset had no reviews. Many others had only a small number of reviews. So, when comparing Salesforce AppExchange marketplace apps, buyers should look at business need fit, product coverage, rating, review count, recent feedback, listing freshness, documentation, and vendor credibility together.
- Third, clear positioning matters for ISVs. Many parts of the market are crowded, especially Sales, Productivity, IT & Administration, Analytics, Sales Cloud, and Service Cloud. In these areas, buyers need to understand not only what the app does, but why it is different from similar tools.
For me, this Salesforce marketplace research is a practical map of public marketplace visibility in June 2026. It shows where buyers have many options, where the market is thinner, and where public trust signals are still missing. That context is what makes the numbers useful.

Mykhailo is a Salesforce Certified Platform Administrator with development experience in the fintech field. Since 2021, he has gained the Double Star Ranger rank on the Salesforce Trailhead education platform, where he acquired 26 Superbadges in Business Administration, Process Automation, Security, and more. With a decade of expertise in consulting and compliance, he aspires to translate complex technical concepts into accessible content, helping organizations make the most of Salesforce. Mykhailo is passionate about using technology for everyday needs, enjoys reading sci-fi and non-fiction books, and playing video games. He also has an interest in history and outdoor activities such as hiking, camping, and kayaking.
 Previous Post
 Next Post