
Forecasting is an essential component of sales management since it aids in planning and educated business decision-making. You can manage your sales projections successfully with Salesforce’s built-in forecasting features.
What Is a Salesforce Sales Forecast?
Sales forecasting in Salesforce offers a projected sales revenue. It outlines the anticipated sales a company aims to achieve within a specified timeframe, such as a quarter or a year. The most effective Salesforce forecasting reports achieve this with remarkable precision. According to recent Salesforce findings, sales teams using AI for forecasting are 1.3 times more likely to see an increase in revenue. In 2024, 83% of sales teams utilizing AI reported revenue growth, compared to just 66% of those not using AI tools.
The sources of input for sales forecasts can vary, ranging from the instincts of sales representatives to advanced artificial intelligence (AI) algorithms. However, all sales forecasts address two fundamental questions:
How much:
Each sales opportunity is associated with a specific Salesforce revenue forecasting projection for the business. This could range from $500 to $5 million, and sales teams need to assign a definitive value for that potential business. This estimation is derived from a comprehensive understanding of the prospect’s details.
When:
Sales forecasts in Salesforce identify a specific month, quarter, or year in which the sales team anticipates the revenue to come in.
These two projections are difficult to determine. Therefore, to improve predictions, sales teams take into account several important elements such as who, what, where, why, and how.
Who:
Understanding the characteristics of prospects shapes opportunity forecasting in Salesforce.
What:
It’s essential to build projections on the precise solutions intended for sale, which in turn should solve the difficulties that prospects have explicitly said they face and that your business is uniquely positioned to handle.
Where:
Understanding where the purchasing decision occurs and the intended location for the product’s usage can enhance forecast accuracy. Sales teams often find improved accuracy when they’re closely connected to the primary site of activity.
Why:
The underlying reason a prospect or existing client is contemplating your company’s services is crucial. Is there a specific event prompting this consideration? Without a clear rationale or pressing need, there’s a potential for the transaction to stagnate.
How:
Understanding a prospect’s current and past purchasing habits is vital. Overlooking this aspect in your forecast might lead to imprecise predictions.
Setup Sales Forecasting in Salesforce: Step by Step Guide
- Fundamental Setup
Salesforce offers an integrated Salesforce sales forecasting tool that streamlines the management of your forecasts. Here’s how to initiate customizable forecasting reports in Salesforce:
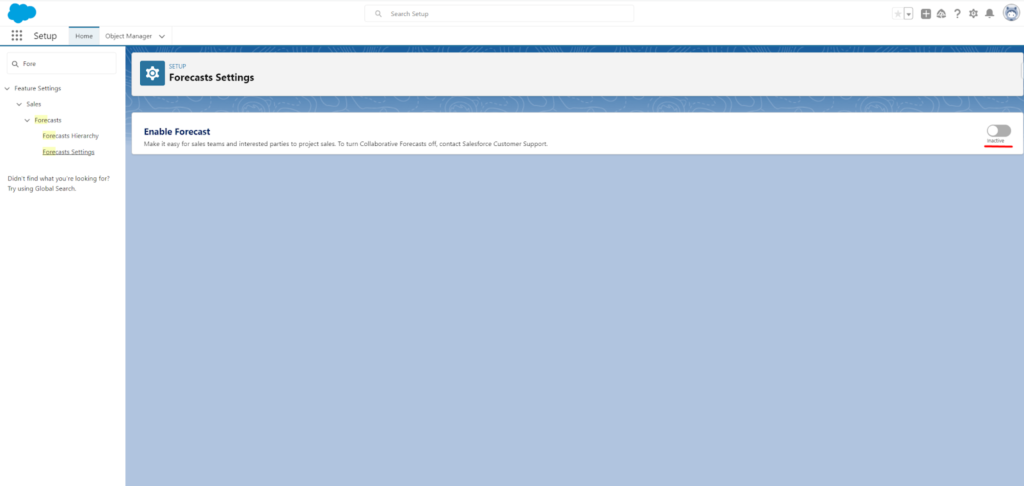
- Activate Forecasting
Navigate to Setup, choose Forecast Settings, and then turn on forecasting for your organization.
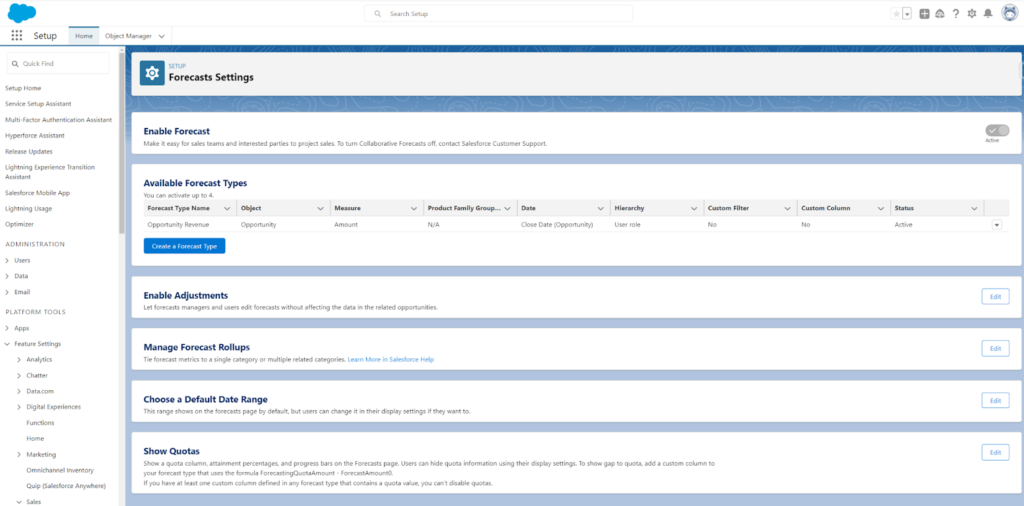
Create Forecast Type: Select Create Forecast Type
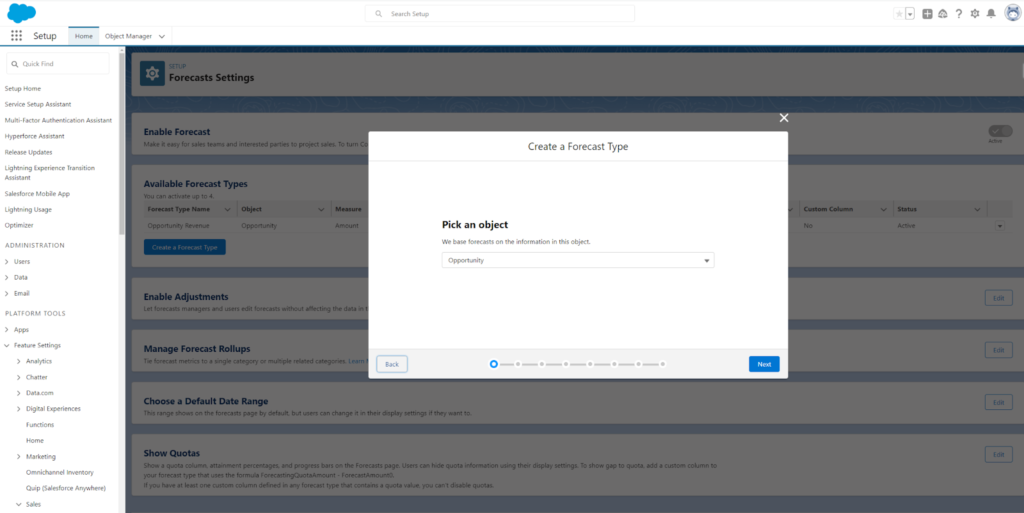
Hit the Next button; then select the Object for which you’d like to activate forecasting.
Click Next and specify a measure
Choose a hierarchy
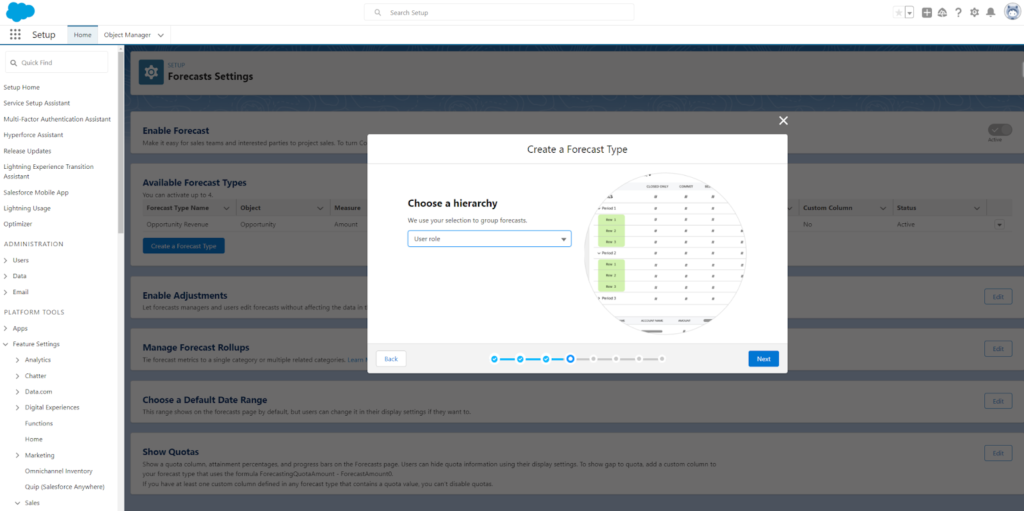
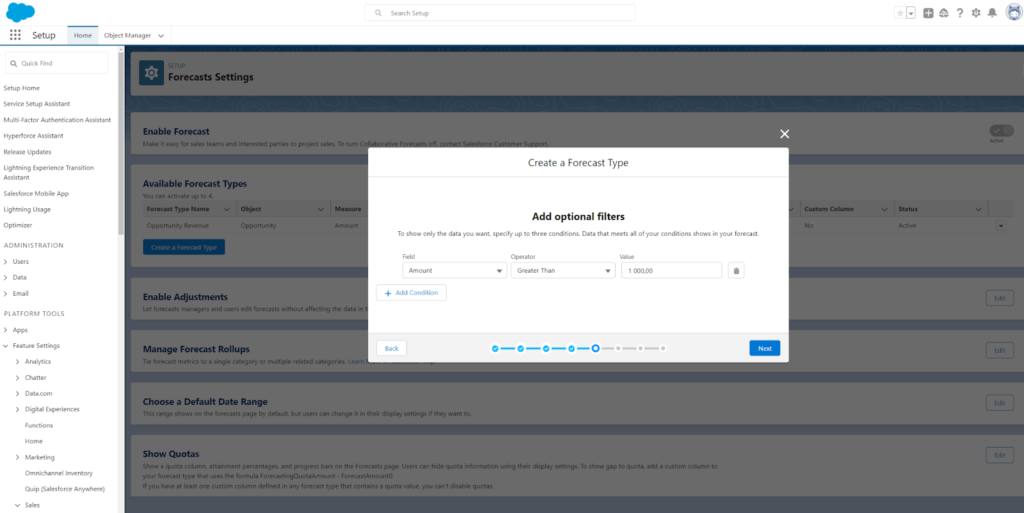
Add Optional Filters
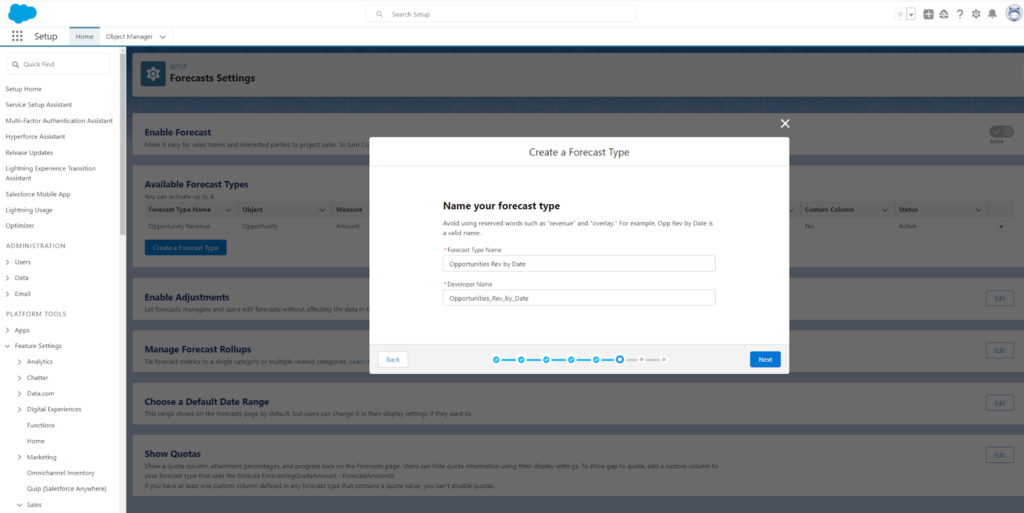
Name your Forecast Type
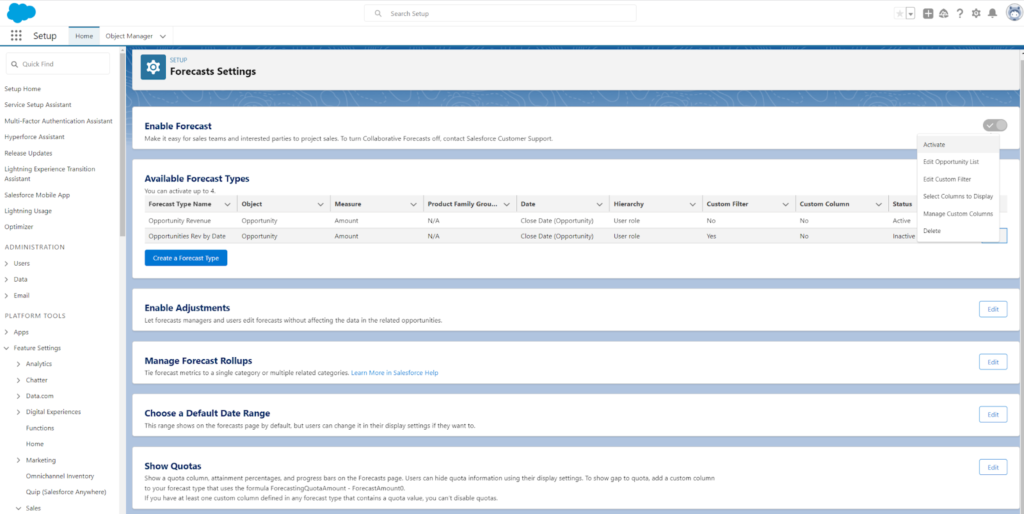
Select Activate your Forecast
Go to the Home Page and select Forecasts
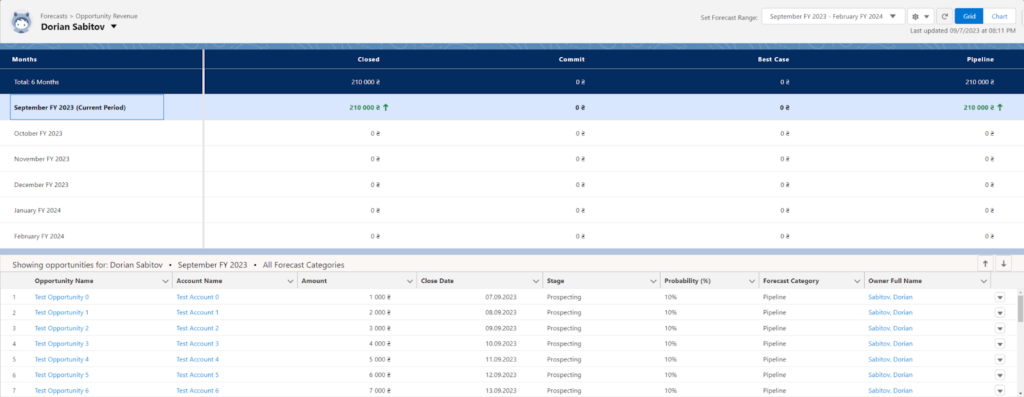
For charting this data, pick “Chart” located at the upper-right edge
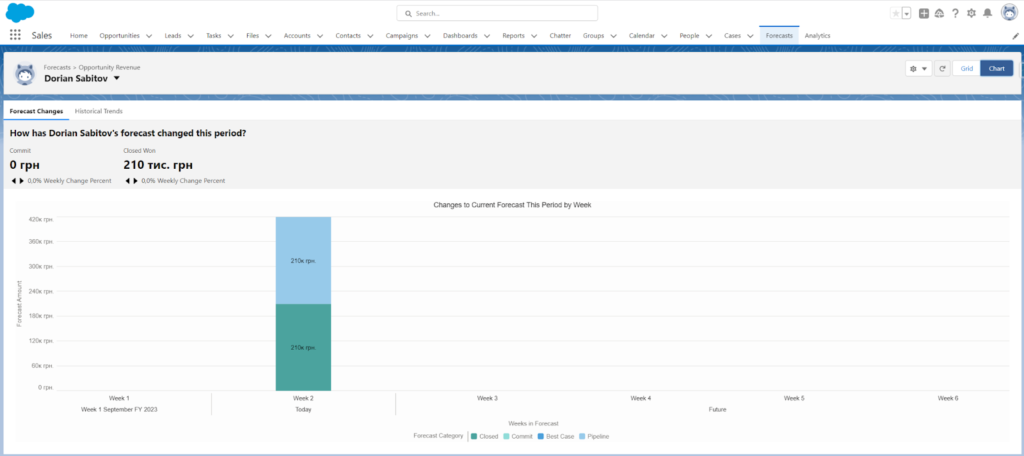
Create a Forecasting Report:
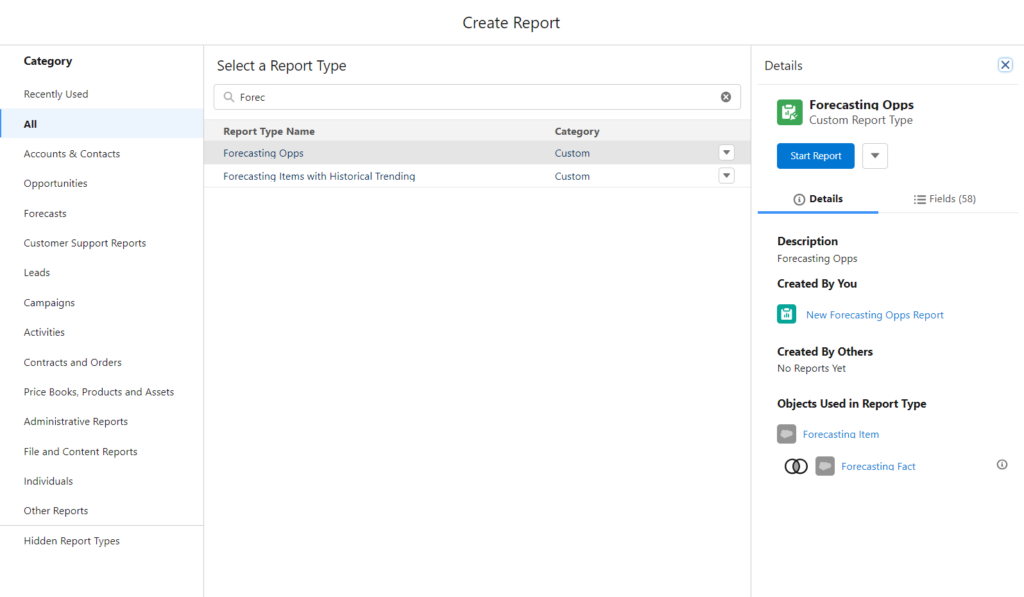
- Go to the Reports tab and create a new report using the Forecasting report type. Customize the report by adding fields, filters, and grouping as needed.
- Select Reports and click on New Report, then select Forecasting Opps as a resource.
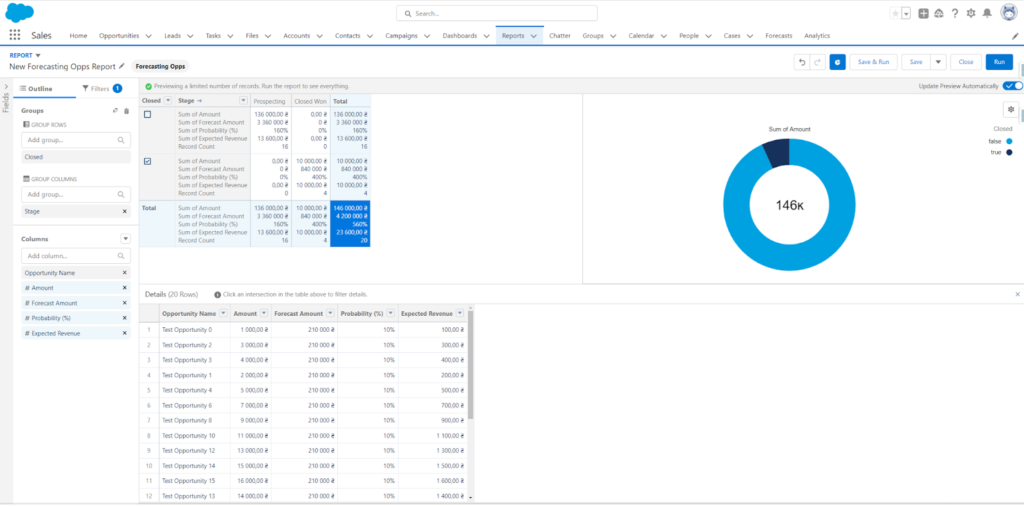
In the Filters section you can select all necessary filter criteria
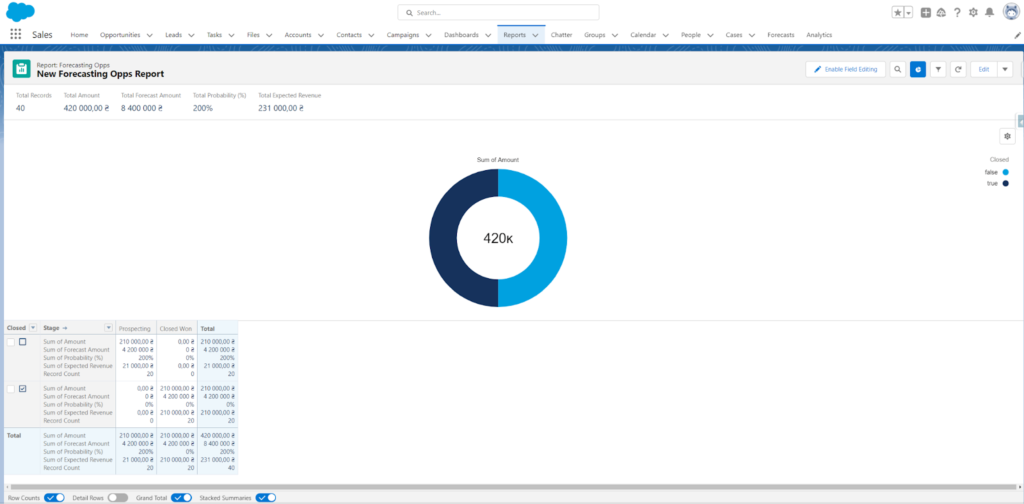
Click Save & Run. This report can now be used for forecasting visualizations and as a component of dashboards.
Advanced Implementation of Salesforce Sales Forecasting
If you need more than basic tools for forecasting, look at these apps on Salesforce AppExchange. They can help with complex needs.
Tableau
When Tableau integrates with Salesforce, the potential is vast:
- Sales Data Visualization
With Tableau, you have the flexibility to import a variety of Salesforce data categories, including but not limited to Leads, Opportunities, and Accounts. This gives you a graphical look at your sales cycle, clarifying complex data points.
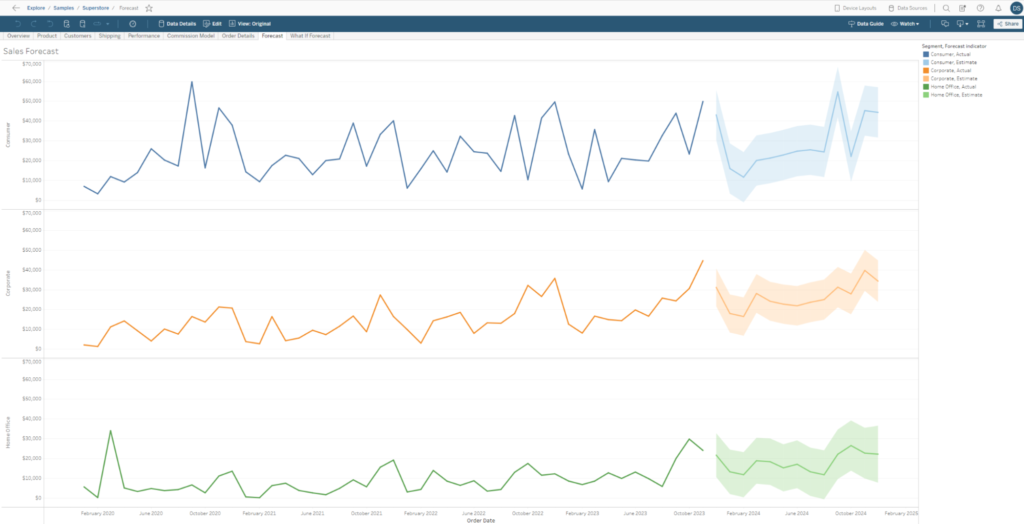
- Insightful Predictions
When you integrate Tableau with your Salesforce data, you’re not just looking at numbers, you’re forecasting them. This enables you to project your earnings for the coming months, evaluate the conversion rates of your leads, and even gauge the risk of customer attrition.
- Customizable Dashboards
Tailoring Tableau dashboards to suit the specific needs of individual roles within your organization isn’t just a feature, it’s a game-changer. Whether you’re a sales rep or a C-suite executive, you’ll have insights that are not only relevant but also actionable, right at your fingertips.
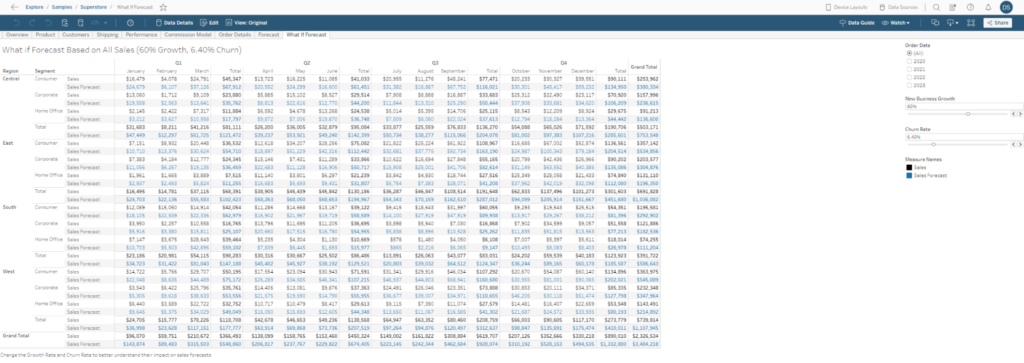
Insights:
By combining Tableau’s forecasting skills with Salesforce’s extensive data ecosystem, enterprises can obtain improved predictive insights. Companies can prepare proactively, distribute resources wisely, and reduce possible risks because of this synergy. The connection is a crucial tool for business growth since it not only provides a picture of previous performance (as shown in typical Salesforce reports) but also sheds light on potential future trends.
Maintaining accurate and complete data in Salesforce sales forecasting is a must if you want to get the most out of Tableau’s forecasting capabilities with Salesforce. The quality of the previous data supplied into the model has a significant impact on how accurate the forecasts are.
QlikView for Salesforce

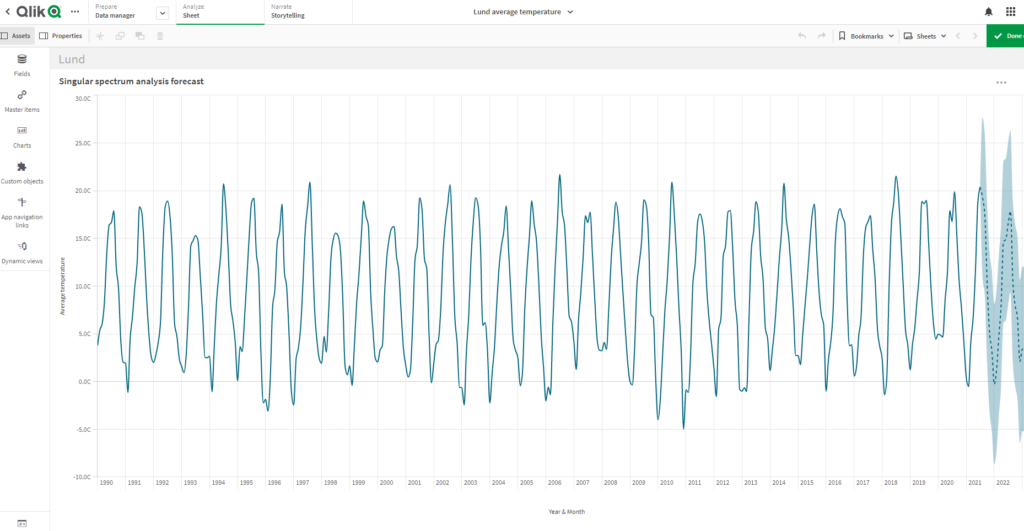
In the business intelligence space, QlikView excels, especially when teamed up with Salesforce. This pairing serves to convert unprocessed Salesforce data into interactive boards and reports, thereby aiding in both future casting and complex analysis. Learn more about QlikView Salesforce.
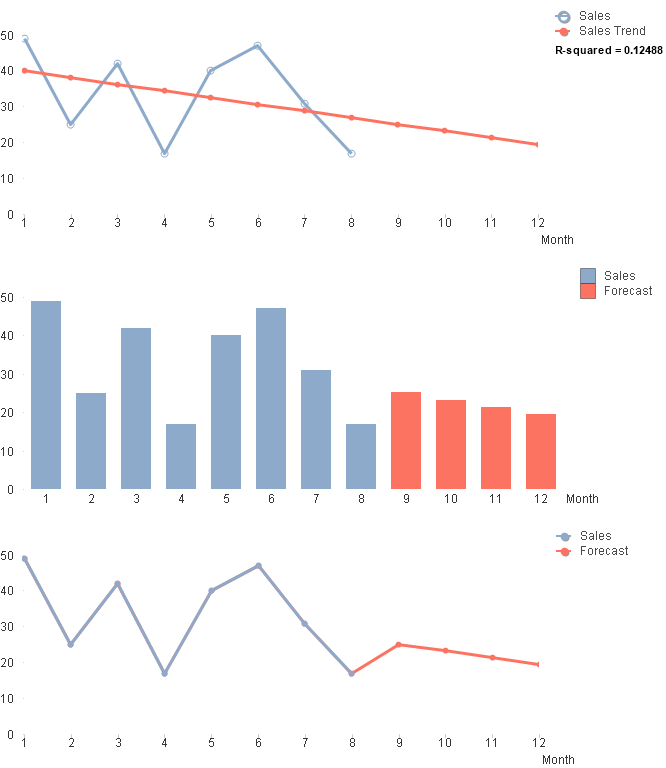
QlikView’s Forecasting Prowess:
- Informed Decision-making: By analyzing trends across the sales cycle, QlikView assists businesses in predicting pipeline trajectories, ensuring that decision-making is backed by data-derived insights.
- Sales Boost: The platform helps increase sales by giving you a deep look at your CRM data. This way, you can find chances to sell more products to current customers.
- Marketing Insights: QlikView excels at linking the success of your marketing moves to your sales. It helps you sharpen your marketing to better fit your sales targets.
Insight:
Since forecasts can change, it’s smart to revisit and update them regularly. This keeps your outlook accurate.
- Utilize Historical Data
Historical data can guide your plans. It helps you forecast better.
Make sure members of your sales team are proficient in using Salesforce for creating and updating sales forecasting.
Check for additional information our article about “Qlik vs Tableau“.
FAQs on Creating Customizable Forecasting Reports in Salesforce
What features do Salesforce forecasting tools offer to enhance predictive accuracy?
Salesforce forecasting tools offer a range of features designed to enhance predictive accuracy and adapt to various business models. Key features include customizable forecasting categories that can be tailored to specific sales processes and timelines. Users can define different types of forecasts for revenue, quantity, and other custom metrics. Salesforce also provides adjustable forecasting periods, whether monthly, quarterly, or annually, to match the organization’s reporting needs. Advanced analytics capabilities, including AI-powered insights from Salesforce Einstein, offer predictive forecasting that can identify trends and suggest adjustments. These tools allow for role-based forecasting hierarchies, ensuring that data relevant to a specific user’s role is accessible and that aggregate forecasts reflect the contributions from all levels of the sales organization.
How can Salesforce revenue forecasting reports benefit business planning?
Salesforce revenue forecasting reports provide critical insights into future sales performance, aiding in strategic business planning and decision-making. These reports allow businesses to estimate future revenue based on current sales data and trends, helping managers set realistic sales targets and allocate resources efficiently. They also enable companies to identify potential shortfalls or opportunities in advance, allowing for proactive adjustments to sales strategies. Furthermore, revenue forecasting reports can improve financial planning by providing more accurate projections that finance teams can use for budgeting and cash flow management. Overall, these reports enhance transparency and coordination across departments, leading to more aligned and effective operational planning.
How to run a forcast report in Salesforce effectively?
Running a forecast report in Salesforce effectively involves several key steps:
- Configure Forecast Settings: Ensure your Salesforce system is set up with the correct forecast settings, including fiscal year setup, forecast types, and currency settings if applicable.
- Customize Forecast Hierarchy: Define the forecast hierarchy to align with your organizational structure. This ensures that data rolls up correctly and that managers have visibility into their team’s forecasts.
- Select the Forecast Period: Choose the specific time period for which you want to generate the forecast, such as the current quarter or next fiscal year.
- Apply Necessary Filters: Use filters to refine the data in your forecast. For instance, you can filter by product family, region, or any other relevant dimension to focus on specific areas.
- Run the Report: Navigate to the Forecasts tab, select your configured forecast type and period, and view the generated forecast. You can export this data to Excel or another format for further analysis or presentation.
- Review and Adjust: Regularly review the forecast accuracy, compare it against actual sales outcomes, and adjust your forecasting model and assumptions as needed.
How to set up forecasting in Salesforce?
Setting up forecasting in Salesforce involves a structured approach to ensure accuracy and usability:
- Define Forecasting Components: Start by defining the components of your forecast, such as revenue, quantity, and custom metrics you want to track.
- Customize Forecast Categories: Customize the forecast categories to match your sales stages or business-specific milestones.
- Establish Forecast Hierarchy: Set up a forecasting hierarchy that reflects your organizational structure, ensuring managers have visibility into their direct reports’ forecasts.
- Configure Forecast Periods: Configure the periods for which forecasts are needed, aligning them with your financial planning cycles.
- Enable Forecasting Features: Enable necessary Salesforce forecasting features and permissions for users involved in the forecasting process.
- Train Users: Train relevant team members on how to input data into the forecast, run reports, and interpret the results.
In Conclusion
For making smart business choices, Salesforce is your go-to tool for sales forecasting. It’s got you covered for most of your needs. But when things get tricky, don’t worry; you can bring in experts like Tableau and QlikView. These tools dive deep into the data, offering you more insights. So, pay attention to what your business needs in forecasting, and pick the tools that fit best. That way, you’ll have accurate, actionable data to ramp up your sales and grow your business.

Dorian is a 6X Certified Salesforce Developer and Administrator with a start in the IT world as a CRM Admin in 2020. Since diving into Salesforce in 2021 via Trailhead and Focus on Force, he has achieved a Ranger Rank, earned several Superbadges, and bagged certifications including the Salesforce Certified Administrator, Platform App Builder, Associate and Platform Developer I by 2023. In 2024 he also became Salesforce Certified AI Associate and earned Certified AI Specialist Certification in 2025. Dorian is very keen on continuous learning, always looks for fresh ways to improve his knowledge. He enjoys running, boxing, kickboxing and reading diverse kinds of books in his free time.


 Previous Post
 Next Post
Hope it helps!